help me in this chart

#1


I want following things in this chart,
1) Moving Averages should come in front of candles.
2) The values at the top are in one line which get cut,How can I get those in two lines?
Please help me
 

asnavale

Well-Known Member
#2


I want following things in this chart,
1) Moving Averages should come in front of candles.
2) The values at the top are in one line which get cut,How can I get those in two lines?
Please help me
Hi sanjay,

For your query No. 2 you enable title wrapping. On the chart right click and click on Axis and Grid tab. Down in the menu you have Miscellaneous in which there is an option 'Wrap Title'. Select Yes for it and the title will wrap around to next line.

-Anant
 
#3
Anant Sir,Many thanks!
1)Axis and frid option did not come by right clicking,However I did it by adding "SetChartOptions(2, chartWrapTitle );" to the formula.
2)What about my first query? Hope you will find something.
 

asnavale

Well-Known Member
#4
Anant Sir,Many thanks!
1)Axis and frid option did not come by right clicking,However I did it by adding "SetChartOptions(2, chartWrapTitle );" to the formula.
2)What about my first query? Hope you will find something.
Hi sanjay,

The Axis&Grid Option is on the top of the pop-up window which appears when you right-click. However, what you have done is correct. By specifying the wrap title option in AFL always plots the title wrapped.

For 1) you can change the order of plotting in two ways:
A) By specifying the 'Zorder' option in Plot(....) command
B) By plotting the Price last and the indicator first. AmiBroker plots the graphs in reverse order of calling the plot function. Therefore, if you have the following code:

Plot(C, .....);
Plot(MA(C, x), ....);

The Plot of C will be above that of MA. As plot(C,...) is called first (before calling Plot(MA..) function) the MA will be plotted first and C is plotted above it (in reverse order of calling).

To have MA plotted above C, the calling order should be:

Plot(MA(.....);
Plot(C,....);

-Anant
 
#6
Anant Sir,
Please correct Zorder in this
_SECTION_BEGIN("Price1");
SetChartOptions(0,chartShowArrows|chartShowDates);
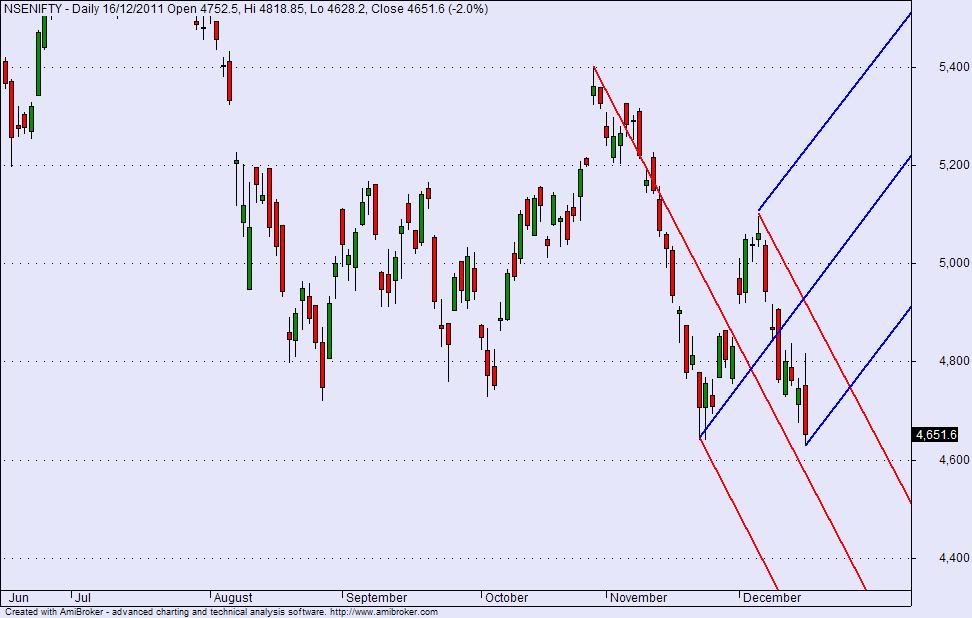
_N(Title = StrFormat("{{NAME}} - {{INTERVAL}} {{DATE}} Open %g, Hi %g, Lo %g, Close %g (%.1f%%) {{VALUES}}", O, H, L, C, SelectedValue( ROC( C, 1 ) ) ));
Plot( C, "Close", ParamColor("Color", colorBlack ), styleNoTitle | ParamStyle("Style") | GetPriceStyle(),Z=0 );
_SECTION_END();

_SECTION_BEGIN("EMA");
P = ParamField("Price field",2);
Periods = Param("Periods", 15, 2, 300, 1, 10 );
Plot( EMA( P, Periods ), _DEFAULT_NAME(), ParamColor( "Color", colorCycle ), ParamStyle("Style"),Z=1 );
_SECTION_END();

_SECTION_BEGIN("EMA1");
P = ParamField("Price field",3);
Periods = Param("Periods", 15, 2, 300, 1, 10 );
Plot( EMA( P, Periods ), _DEFAULT_NAME(), ParamColor( "Color", colorCycle ), ParamStyle("Style"),Z=2 );
_SECTION_END();

_SECTION_BEGIN("EMA2");
P = ParamField("Price field",4);
Periods = Param("Periods", 15, 2, 300, 1, 10 );
Plot( EMA( P, Periods ), _DEFAULT_NAME(), ParamColor( "Color", colorCycle ), ParamStyle("Style"),Z=3 );
_SECTION_END();

_SECTION_BEGIN("EMA3");
P = ParamField("Price field",5);
Periods = Param("Periods", 15, 2, 300, 1, 10 );
Plot( EMA( P, Periods ), _DEFAULT_NAME(), ParamColor( "Color", colorCycle ), ParamStyle("Style"),Z=4 );
_SECTION_END();

_SECTION_BEGIN("EMA4");
P = ParamField("Price field",6);
Periods = Param("Periods", 15, 2, 300, 1, 10 );
Plot( EMA( P, Periods ), _DEFAULT_NAME(), ParamColor( "Color", colorCycle ), ParamStyle("Style"),Z=5 );
_SECTION_END();

SetChartOptions(2, chartWrapTitle );
 

Similar threads