Hello Santosh... try this one.
String = StrLeft(Name(),1);
Condition1 = String == "C" OR String == "I" OR String == "K" OR String == "M" OR String == "W" OR String == "Y";
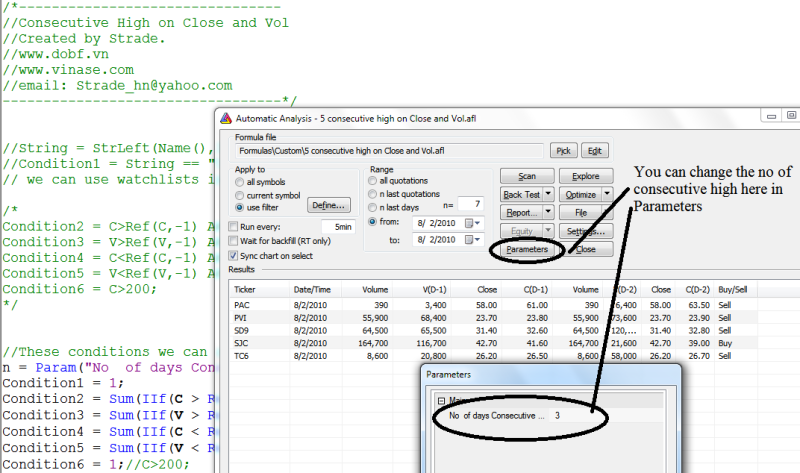
Condition2 = C>Ref(C,-1) AND Ref(C,-1)>Ref(C,-2) AND Ref(C,-2)>Ref(C,-3) AND Ref(C,-3)>Ref(C,-4);
Condition3 = V>Ref(V,-1) AND Ref(V,-1)>Ref(V,-2) AND Ref(V,-2)>Ref(V,-3) AND Ref(V,-3)>Ref(V,-4);
Condition4 = C<Ref(C,-1) AND Ref(C,-1)<Ref(C,-2) AND Ref(C,-2)<Ref(C,-3) AND Ref(C,-3)<Ref(C,-4);
Condition5 = V<Ref(V,-1) AND Ref(V,-1)<Ref(V,-2) AND Ref(V,-2)<Ref(V,-3) AND Ref(V,-3)<Ref(V,-4);
Condition6 = C>200;
Buy = Condition1 AND Condition2 AND Condition3 AND Condition6;
Sell = Condition1 AND Condition4 AND Condition5 AND Condition6;
Filter = Buy OR Sell;
AddColumn(Ref(V,-4),"V(D-4)");
AddColumn(Ref(V,-3),"V(D-3)");
AddColumn(Ref(V,-2),"V(D-2)");
AddColumn(Ref(V,-1),"V(D-1)");
AddColumn(Volume,"Volume");
AddColumn(Close,"Close");
AddColumn(Ref(C,-1),"C(D-1)");
AddColumn(Ref(C,-2),"C(D-2)");
AddColumn(Ref(C,-3),"C(D-3)");
AddColumn(Ref(C,-4),"C(D-4)");
AddTextColumn(WriteIf((C>Ref(C,-1) AND V>Ref(V,-1)),"Buy","Sell"),"Buy/Sell");
_SECTION_BEGIN("Santosh");
SetChartOptions(0,chartShowArrows|chartShowDates);
_N(Title = StrFormat("{{NAME}} - {{INTERVAL}} {{DATE}} Open %g, Hi %g, Lo %g, Close %g (%.1f%%) {{VALUES}}", O, H, L, C, SelectedValue( ROC( C, 1 ) ) ));
Plot( C, "Close", ParamColor("Color", colorBlack ), styleNoTitle | ParamStyle("Style") | GetPriceStyle() );
PlotShapes(shapeUpArrow * Buy, colorGreen,0,L,-12);
_SECTION_END();