


P & F Trend indicator for amibroker
- Thread starter sharehunter
- Start date
Dear all Brothers!
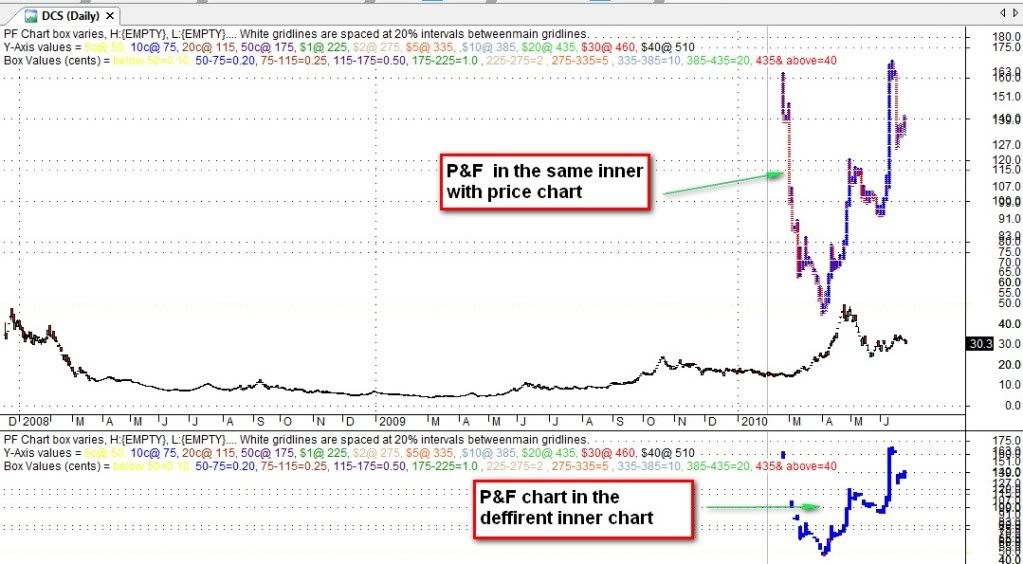
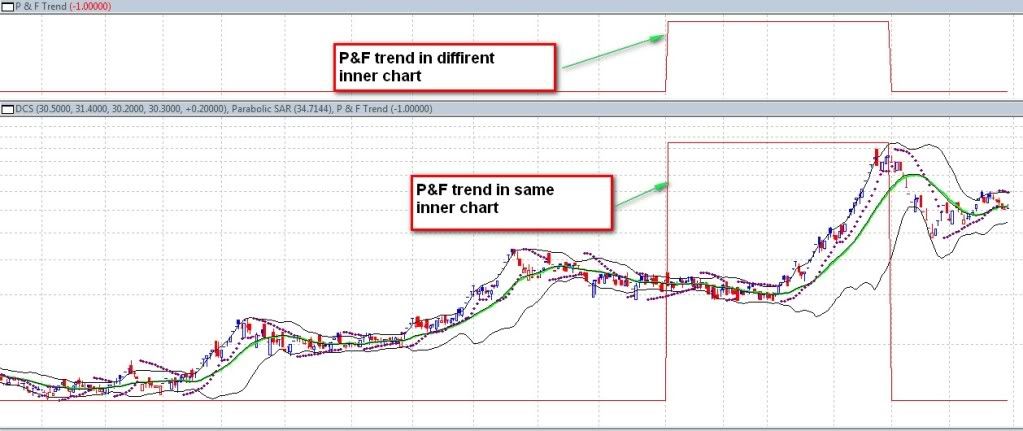
I am searching "P & F trend" indicator (which built in metastock software) in amibroker (already installed PE software) but I can not see. If possible please kindly share it to me or tell me where i can get it
Many many thanks for your helps
I am searching "P & F trend" indicator (which built in metastock software) in amibroker (already installed PE software) but I can not see. If possible please kindly share it to me or tell me where i can get it
Many many thanks for your helps
_SECTION_BEGIN("P&F chart with range box sizes");
/*P&F Chart based on closing prices.
Place entire code in Indicator Builder.
Box size has been set for different price ranges to allow more equitable chart viewing over large data ranges.
The Price ranges are set at change values (cxx) and box values (bxx) below, and are in values of cents. (eg c1000 is $10.00 and b1000 is $0.10 ) My chart price axis is in cents as that is where most of my stock prices reside at lower prices.
Box sizes are set to be eg b10 is for between c5 and c10.
They can be altered here to suit your overall chart values. (eg if you deal more in larger priced stocks, or in $ price axis)
Graham Kavanagh 01/Feb/2003
*/
SetBarsRequired(100000,100000);
//Set the Price limits for change of box values
c5 = 5;
c10 = 10;
c20 = 20;
c50 = 50;
c100 = 100;
c200 = 200;
c500 = 500;
c1000 = 1000;
c2000 = 2000;
c3000 = 3000;
c4000 = 4000;
c5000 = 5000;
//Set box values Bx for the price up to Cx
b5 = 0.1;
b10 = 0.2;
b20 = 0.25;
b50 = 0.5;
b100 = 1;
b200 = 2;
b500 = 5;
b1000 = 10;
b2000 = 20;
binfinity = 40;
//Number of boxes in each price range
nb5 = c5/b5;
nb10 = nb5 + (c10-c5)/b10;
nb20 = nb10 + (c20-c10)/b20;
nb50 = nb20 + (c50-c20)/b50;
nb100 = nb50 + (c100-c50)/b100;
nb200 = nb100 + (c200-c100)/b200;
nb500 = nb200 + (c500-c200)/b500;
nb1000 = nb500 + (c1000-c500)/b1000;
nb2000 = nb1000 + (c2000-c1000)/b2000;
nb3000 = nb2000 + (c3000 - c2000)/binfinity;
nb4000 = nb3000 + (c4000 - c3000)/binfinity;
nb4000 = nb4000 + (c5000 - c4000)/binfinity;
//define box values for each price zone
box = IIf(C<=c5,b5,
IIf(C>c5 AND C<=c10, b10,
IIf(C>c10 AND C<=c20, b20,
IIf(C>c20 AND C<=c50, b50,
IIf(C>c50 AND C<=c100, b100,
IIf(C>c100 AND C<=c200, b200,
IIf(C>c200 AND C<=c500, b500,
IIf(C>c500 AND C<=c1000, b1000,
IIf(C>c1000 AND C<=c2000, b2000,
binfinity )))))))));
//Round the Close data into box equivalents
CF = ceil(C/box)*box;
CR = floor(C/box)*box;
//Rising chart values
CRB = IIf(CR<=c5, 0 + CR/b5,
IIf(CR>c5 AND CR<=c10, nb5+(CR-c5)/b10,
IIf(CR>c10 AND CR<=c20, nb10+(CR-c10)/b20,
IIf(CR>c20 AND CR<=c50, nb20+(CR-c20)/b50,
IIf(CR>c50 AND CR<=c100, nb50+(CR-c50)/b100,
IIf(CR>c100 AND CR<=c200, nb100+(CR-c100)/b200,
IIf(CR>c200 AND CR<=c500, nb200+(CR-c200)/b500,
IIf(CR>c500 AND CR<=c1000, nb500+(CR-c500)/b1000,
IIf(CR>c1000 AND CR<=c2000, nb1000+(CR-c1000)/b2000,
nb2000+(CR-c2000)/binfinity
)))))))));
//Falling chart values
CFB = IIf(CF<=c5, 0 + CF/b5,
IIf(CF>c5 AND CF<=c10, nb5+(CF-c5)/b10,
IIf(CF>c10 AND CF<=c20, nb10+(CF-c10)/b20,
IIf(CF>c20 AND CF<=c50, nb20+(CF-c20)/b50,
IIf(CF>c50 AND CF<=c100, nb50+(CF-c50)/b100,
IIf(CF>c100 AND CF<=c200, nb100+(CF-c100)/b200,
IIf(CF>c200 AND CF<=c500, nb200+(CF-c200)/b500,
IIf(CF>c500 AND CF<=c1000, nb500+(CF-c500)/b1000,
IIf(CF>c1000 AND CF<=c2000, nb1000+(CF-c1000)/b2000,
nb2000+(CF-c2000)/binfinity
)))))))));
//Jscript to produce the P&F chart
EnableScript("jscript");
<%
Close = VBArray( AFL( "Close" ) ).toArray();
CRB = VBArray( AFL( "CRB" ) ).toArray();
CFB = VBArray( AFL( "CFB" ) ).toArray();
PFO = new Array();
PFC = new Array();
Reverse = 3 ; // reversal requirement
// initialize first element
j = 0;
PFC[j] = CFB[0];
PFO[j] = CFB[0]+1;
down = 1; // By default the first bar is a down bar.
up = 0;
swap = 0;
// perform the loop that produces PF Chart
for( i = 1; i < Close.length; i++ )
{
if( CFB <= PFC[j]-1 && down) //continue down
{
PFC[j] = CFB;
PFO[j] = CFB+1;
}
else
{
if( CRB >= PFC[j] + Reverse && down) //Change direction to up
{
j++;
swap = 1;
PFC[j] = CRB;
PFO[j] = CRB - 1;
}
}
if( CRB >= PFC[j] + 1 && up) //Continue up
{
PFC[j] = CRB;
PFO[j] = CRB - 1;
}
else
{
if( CFB <= PFC[j] - Reverse && up) //Change direction to down
{
j++;
PFC[j] = CRB;
PFO[j] = CRB+1;
swap = 1;
}
}
if( swap )
{
swap = 0;
if( up )
{
up = 0;
down = 1;
}
else
{
up = 1;
down = 0;
}
}
}
delta = Close.length - j-1;
AFL.Var("PFO") = PFO;
AFL.Var("PFC") = PFC;
AFL.Var("delta") = delta;
AFL.Var("Reverse") = Reverse;
AFL.Var("j") = j;
%>
PFO = Ref( PFO, -delta );
PFC = Ref( PFC, -delta );
// High-Low range sets the height of the P&F bar
H = IIf(Ref(PFC,-1)>Ref(PFO,-1),Ref(HHV(PFC,1),-1)-1,Max(PFO,PFC));
L = IIf(Ref(PFC,-1)<Ref(PFO,-1),Ref(LLV(PFC,1),-1)+1,Min(PFO,PFC));
O = IIf(Ref(PFC,-1)>Ref(PFO,-1),Ref(HHV(PFC,1),-1)-1,IIf(Ref(PFC,-1)<Ref(PFO,-1),Ref(LLV(PFC,1),-1)+
1,PFO));
// the difference between Open AND Close should be set to box size
// the sign decides if X or O are plotted
C = O + 1 * IIf( PFC > PFO, 1,-1);
//Colours of major gridlines at box values change points. Colours for easier chart identification
Color5 = colorYellow ;
Color10 = colorBlue;
Color20 = colorBrown;
Color50 = colorIndigo;
Color100 = colorGreen;
Color200 = colorTan;
Color500 = colorOrange;
Color1000 = colorLightBlue;
Color2000 = colorLime;
Color3000 = colorRed;
Color4000 = colorBlack;
colorgrid = colorWhite; //colours of intermediate gridlines
GraphXSpace = 5;
Title = "PF Chart box varies, H:" + WriteVal(H,1.0)+ ", L:" + WriteVal(L,1.0) +
".... White gridlines are spaced at 20% intervals betweenmain gridlines." +
"\n" + "Y-Axis values = " +
EncodeColor(color5) + WriteVal(C5,1.0) + "c@ " + WriteVal(nb5,1.0) + ", " +
EncodeColor(color10) + WriteVal(C10,1.0) + "c@ " + WriteVal(nb10,1.0) + ", " +
EncodeColor(color20) + WriteVal(C20,1.0) + "c@ " + WriteVal(nb20,1.0) + ", " +
EncodeColor(color50) + WriteVal(C50,1.0) + "c@ " + WriteVal(nb50,1.0) + ", " +
EncodeColor(color100) + "$" + WriteVal(C100/100,1.0) + "@ " + WriteVal(nb100,1.0) + ", " +
EncodeColor(color200) + "$" + WriteVal(C200/100,1.0) + "@ " + WriteVal(nb200,1.0) + ", " +
EncodeColor(color500) + "$" + WriteVal(C500/100,1.0) +"@ " + WriteVal(nb500,1.0) + ", " +
EncodeColor(color1000)+",$"+WriteVal(C1000/100,1.0) + "@ " + WriteVal(nb1000,1.0) + ", " +
EncodeColor(color2000) + "$" + WriteVal(C2000/100,1.0) + "@ " + WriteVal(nb2000,1.0) + ", " +
EncodeColor(color3000) + "$" + WriteVal(C3000/100,1.0) + "@ " + WriteVal(nb3000,1.0) + ", " +
EncodeColor(color4000) + "$" + WriteVal(C4000/100,1.0) + "@ " + WriteVal(nb4000,1.0) +"\n"+
"Box Values (cents) = "+
EncodeColor(color5)+"below " +WriteVal(nb5,1.0) + "=" + WriteVal(b5,1.2) + ", " +
EncodeColor(color10)+WriteVal(nb5,1.0)+"-"+WriteVal(nb10,1.0)+"="+WriteVal(b10,1.2)+", "+
EncodeColor(color20)+WriteVal(nb10,1.0)+"-"+WriteVal(nb20,1.0)+"="+WriteVal(b20,1.2)+", "+
EncodeColor(color50)+WriteVal(nb20,1.0)+"-"+WriteVal(nb50,1.0)+"="+WriteVal(b50,1.2)+", "+
EncodeColor(color100)+WriteVal(nb50,1.0)+"-"+WriteVal(nb100,1.0)+"="+WriteVal(b100,1.1)+", "+
EncodeColor(color200)+WriteVal(nb100,1.0)+"-"+WriteVal(nb200,1.0)+"="+WriteVal(b200,1.0)+", "+
EncodeColor(color500)+WriteVal(nb200,1.0)+"-"+WriteVal(nb500,1.0)+"="+WriteVal(b500,1.0)+", "+
EncodeColor(color1000)+WriteVal(nb500,1.0)+"-"+WriteVal(nb1000,1.0)+"="+WriteVal(b1000,1.0)+", "+
EncodeColor(color2000)+WriteVal(nb1000,1.0)+"-"+WriteVal(nb2000,1.0)+"="+WriteVal(b2000,1.0)+", "+
EncodeColor(color3000 )+WriteVal(nb2000,1.0)+"& above"+"="+WriteVal(binfinity,1.0);
Plot(C,"P&F Chart Close",IIf( PFC > PFO, colorBlue, colorRed ),styleCandle+styleNoLabel+stylePointAndFigure);
PlotGrid( nb5, color5 );
PlotGrid( nb10, color10 );
PlotGrid( nb20, color20 );
PlotGrid( nb50, color50 );
PlotGrid( nb100, color100 );
PlotGrid( nb200, color200 );
PlotGrid( nb500, color500 );
PlotGrid( nb1000, color1000 );
PlotGrid( nb2000, color2000 );
PlotGrid( nb3000, color3000 );
PlotGrid( nb4000, color4000 );
PlotGrid(nb5*0.2,colorgrid);
PlotGrid(nb5*0.4,colorgrid);
PlotGrid(nb5*0.6,colorgrid);
PlotGrid(nb5*0.8,colorgrid);
PlotGrid(nb5+(nb10-nb5)*0.2,colorgrid);
PlotGrid(nb5+(nb10-nb5)*0.4,colorgrid);
PlotGrid(nb5+(nb10-nb5)*0.6,colorgrid);
PlotGrid(nb5+(nb10-nb5)*0.8,colorgrid);
PlotGrid(nb10+(nb20-nb10)*0.2,colorgrid);
PlotGrid(nb10+(nb20-nb10)*0.4,colorgrid);
PlotGrid(nb10+(nb20-nb10)*0.6,colorgrid);
PlotGrid(nb10+(nb20-nb10)*0.8,colorgrid);
PlotGrid(nb20+(nb50-nb20)*0.2,colorgrid);
PlotGrid(nb20+(nb50-nb20)*0.4,colorgrid);
PlotGrid(nb20+(nb50-nb20)*0.6,colorgrid);
PlotGrid(nb20+(nb50-nb20)*0.8,colorgrid);
PlotGrid(nb50+(nb100-nb50)*0.2,colorgrid);
PlotGrid(nb50+(nb100-nb50)*0.4,colorgrid);
PlotGrid(nb50+(nb100-nb50)*0.6,colorgrid);
PlotGrid(nb50+(nb100-nb50)*0.8,colorgrid);
PlotGrid(nb100+(nb200-nb100)*0.2,colorgrid);
PlotGrid(nb100+(nb200-nb100)*0.4,colorgrid);
PlotGrid(nb100+(nb200-nb100)*0.6,colorgrid);
PlotGrid(nb100+(nb200-nb100)*0.8,colorgrid);
PlotGrid(nb200+(nb500-nb200)*0.2,colorgrid);
PlotGrid(nb200+(nb500-nb200)*0.4,colorgrid);
PlotGrid(nb200+(nb500-nb200)*0.6,colorgrid);
PlotGrid(nb200+(nb500-nb200)*0.8,colorgrid);
PlotGrid(nb500+(nb1000-nb500)*0.2,colorgrid);
PlotGrid(nb500+(nb1000-nb500)*0.4,colorgrid);
PlotGrid(nb500+(nb1000-nb500)*0.6,colorgrid);
PlotGrid(nb500+(nb1000-nb500)*0.8,colorgrid);
PlotGrid(nb1000+(nb2000-nb1000)*0.2,colorgrid);
PlotGrid(nb1000+(nb2000-nb1000)*0.4,colorgrid);
PlotGrid(nb1000+(nb2000-nb1000)*0.6,colorgrid);
PlotGrid(nb1000+(nb2000-nb1000)*0.8,colorgrid);
PlotGrid(nb2000+(nb3000-nb2000)*0.2,colorgrid);
PlotGrid(nb2000+(nb3000-nb2000)*0.4,colorgrid);
PlotGrid(nb2000+(nb3000-nb2000)*0.6,colorgrid);
PlotGrid(nb2000+(nb3000-nb2000)*0.8,colorgrid);
PlotGrid(nb3000+(nb4000-nb3000)*0.2,colorgrid);
PlotGrid(nb3000+(nb4000-nb3000)*0.4,colorgrid);
PlotGrid(nb3000+(nb4000-nb3000)*0.6,colorgrid);
PlotGrid(nb3000+(nb4000-nb3000)*0.8,colorgrid);
_SECTION_END();
_SECTION_BEGIN("P&F Daily");
//AFL P&F Chart for Amibroker Indicator window. Based on High/low prices.
//Based on code in AB help files
//Reverse is 2 boxes.
//Graham Kavanagh 30 Sep 2003
Version(4.40);
SetBarsRequired(100000,100000);
//Size for P&F boxes
boxsize=IIf(C>=0.01 AND C<10, 0.05,
IIf(C>=10 AND C<20, 0.10,
IIf(C>=20 AND C<30, 0.15,
IIf(C>=30 AND C<40, 0.20,
IIf(C>=40 AND C<50, 0.25,
IIf(C>=50 AND C<60, 0.30,
IIf(C>=60 AND C<70, 0.35,
IIf(C>=70 AND C<80, 0.40,
IIf(C>=80 AND C<90, 0.45,
IIf(C>=90 AND C<100, 0.50,
IIf(C>=100 AND C<150, 0.75,
IIf(C>=150 AND C<200, 1.00,
IIf(C>=200 AND C<250, 1.25,
IIf(C>=250 AND C<300, 1.50,
IIf(C>=300 AND C<350, 1.75,
IIf(C>=350 AND C<400, 2.00,
IIf(C>=400 AND C<450, 2.25,
IIf(C>=450 AND C<500, 2.50,
IIf(C>=500 AND C<550, 2.75,
IIf(C>=550 AND C<600, 3.00,
IIf(C>=600 AND C<650, 3.25,
IIf(C>=650 AND C<700, 3.50,
IIf(C>=700 AND C<750, 3.75,
IIf(C>=750 AND C<800, 4.00,
IIf(C>=800 AND C<850, 4.25,
IIf(C>=850 AND C<900, 4.50,
IIf(C>=900 AND C<950, 4.75,
IIf(C>=950 AND C<1000, 5.00,
IIf(C>=1000 AND C<1100, 5.50,
IIf(C>=1100 AND C<1200, 6.00,
IIf(C>=1200 AND C<1300, 6.50,
IIf(C>=1300 AND C<1400, 7.00,
IIf(C>=1400 AND C<1500, 7.50,
IIf(C>=1500 AND C<1600, 8.00,
IIf(C>=1600 AND C<1700, 8.50,
IIf(C>=1700 AND C<1800, 9.00,
IIf(C>=1800 AND C<1900, 9.50,
IIf(C>=1900 AND C<2000, 10.00,
IIf(C>=2000 AND C<2100, 10.50,
IIf(C>=2100 AND C<2200, 11.00,
IIf(C>=2200 AND C<2300, 11.50,
IIf(C>=2300 AND C<2400, 12.00,
IIf(C>=2400 AND C<2500, 12.50,
IIf(C>=2500 AND C<2600, 13.00,
IIf(C>=2600 AND C<2700, 13.50,
IIf(C>=2700 AND C<2800, 14.00,
IIf(C>=2800 AND C<2900, 14.50,
IIf(C>=2900 AND C<3000, 15.00,
IIf(C>=3000 AND C<3100, 15.50,
IIf(C>=3100 AND C<3200, 16.00,
IIf(C>=3200 AND C<3300, 16.50,
IIf(C>=3300 AND C<3400, 17.00,
IIf(C>=3400 AND C<3500, 17.50,
IIf(C>=3500 AND C<3600, 18.00,
IIf(C>=3600 AND C<3700, 18.50,
IIf(C>=3700 AND C<3800, 19.00,
IIf(C>=3800 AND C<3900, 19.50,
IIf(C>=3900 AND C<4000, 20.00,
IIf(C>=4000 AND C<4100, 20.50,
IIf(C>=4100 AND C<4200, 21.00,
IIf(C>=4200 AND C<4300, 21.50,
IIf(C>=4300 AND C<4400, 22.00,
IIf(C>=4400 AND C<4500, 22.50,
IIf(C>=4500 AND C<4600, 23.00,
IIf(C>=4600 AND C<4700, 23.50,
IIf(C>=4700 AND C<4800, 24.00,
IIf(C>=4800 AND C<4900, 24.50,
IIf(C>=4900 AND C<5000, 25.00,
IIf(C>=5000 AND C<6000, 30,
IIf(C>=6000 AND C<7000, 35,
IIf(C>=7000 AND C<8000, 40,
IIf(C>=8000 AND C<9000, 45,
IIf(C>=9000 AND C<10000, 50,
IIf(C>=10000 AND C<11000, 55,
IIf(C>=11000 AND C<12000, 60,
IIf(C>=12000 AND C<13000, 65,
IIf(C>=13000 AND C<14000, 70,
IIf(C>=14000 AND C<15000, 75,
IIf(C>=15000 AND C<16000, 80,
IIf(C>=16000 AND C<17000, 85,
IIf(C>=17000 AND C<18000, 90,
IIf(C>=18000 AND C<19000, 95,
IIf(C>=19000 AND C<20000, 100,
IIf(C>=20000 AND C<21000, 105,
IIf(C>=21000 AND C<22000, 110,
IIf(C>=22000 AND C<23000, 115,
IIf(C>=23000 AND C<24000, 120,
IIf(C>=24000 AND C<25000, 125,
IIf(C>=25000 AND C<26000, 130,
IIf(C>=26000 AND C<27000, 135,
IIf(C>=27000 AND C<28000, 140,
IIf(C>=28000 AND C<29000, 145,
IIf(C>=29000 AND C<30000, 150,
IIf(C>=30000 AND C<31000, 155,
IIf(C>=31000 AND C<32000, 160,
IIf(C>=32000 AND C<33000, 165,
IIf(C>=33000 AND C<34000, 170,
IIf(C>=34000 AND C<35000, 175,
200 ))))))))))))))))))))))))))))))))))))))))))))))))))))))))))))))))))))))))))))))))))))))))))))))))));
Box = LastValue(boxsize);
HX = round((H/box)*10)/10;
LX = round((L/box)*10)/10;
RH = floor(HX);
FL = ceil(LX);
// initialize first element
j = 0;
Reverse = 3; // reversal requirement
PFC[j] = FL[0];
PFO[j] = PFC[j] + 1;
down = 1; // By default the first bar is a down bar.
up = 0;
swap = 0;
// perform the loop that produces PF Chart
for( i = 1; i < BarCount; i++ )
{
if( FL <= PFC[j]-1 && down) //continue down
{
PFC[j] = FL;
PFO[j] = PFC[j] + 1;
}
else
{
if( RH >= PFC[j] + Reverse && down) //Change direction to up
{
j++;
swap = 1;
PFC[j] = RH;
PFO[j] = PFC[j]-1;
}
}
if( RH >= PFC[j] + 1 && up) //Continue up
{
PFC[j] = RH;
PFO[j] = PFC[j] - 1;
}
else
{
if( FL <= PFC[j] - Reverse && up) //Change direction to down
{
j++;
PFC[j] = FL;
PFO[j] = PFC[j] + 1;
swap = 1;
}
}
if( swap )
{
swap = 0;
if( up )
{
up = 0;
down = 1;
}
else
{
up = 1;
down = 0;
}
}
}
delta = BarCount - j-1;
PFO = Ref( PFO, -delta );
PFC = Ref( PFC, -delta );
// High-Low range sets the height of the P&F bar
H = IIf(Ref(PFC,-1)>Ref(PFO,-1),Ref(HHV(PFC,1),-1)-1,Max(PFO,PFC))*Box;
L = IIf(Ref(PFC,-1)<Ref(PFO,-1),Ref(LLV(PFC,1),-1)+1,Min(PFO,PFC))*Box;
O = IIf(Ref(PFC,-1)>Ref(PFO,-1),Ref(HHV(PFC,1),-1)-1,IIf(Ref(PFC,-1)<Ref(PFO,-1),Ref(LLV(PFC,1),-1)+1,PFO))*Box;
// the difference between Open AND Close should be set to box size
// the sign decides if X or O are plotted
C = O + Box * IIf( PFC > PFO, 1,-1);
GraphXSpace = 2;
Title ="No Jscript " + Name()+ " PF HiLo, H: " + H+ ", L: " + L+", Box: "+ box + ", Reversal: " + reverse;
Plot( C, "P&F Chart Close", IIf( PFC > PFO, colorBlue, colorRed ), styleCandle+styleNoLabel+stylePointAndFigure);
hbar1 = H ;
hbar2 = Ref(H,-2) ;
lbar1 = L ;
lbar2 = Ref(L,-2) ;
Buy = IIf( hbar1 > hbar2 AND PFC > PFO ,True,False);
Sell = IIf(lbar1 < lbar2 AND PFC < PFO ,True,False);
x = Buy;
y = Sell;
Buy = ExRem( Buy, Sell );
Sell = ExRem( Sell, Buy );
PlotShapes(shapeSmallUpTriangle * Buy, colorGreen, 0, L, -12);
PlotShapes(shapeSmallDownTriangle * Sell, colorRed, 0, H, -12);
" Last Bar " + LastValue( BarIndex()-2 );
AlertIf( Sell, "SOUND C:\\Windows\\Media\\Ding.wav", "Sell", 2 );
AlertIf( Buy, "SOUND C:\\Windows\\Media\\Ding.wav", "Buy", 1 );
Filter = 1; /* all symbols and quotes accepted */
//filer = Buy OR Sell ;
AddColumn(Open,"OPEN",1);
AddColumn(High,"HIGH",1);
AddColumn(Low,"LOW",1);
AddColumn(Close,"CLOSE",1);
AddColumn(V,"VOLUME",1);
AddColumn(x,"Buy Above" , 1);
AddColumn(y,"Sell Below", 1);
AddColumn(hbar2,"Hbar-2", 1);
_SECTION_END();
_SECTION_BEGIN( "Point & Figure w Values adj" );
GraphXSpace = 5;
SetChartBkColor( ParamColor( "BackGroundColor", colorBlack) );
//GraphColor = ParamColor("GarphColor",colorLightGrey);
GridColor = ParamColor( "GridColor", colorLightGrey );
Scaling = ParamList( "Scaling Method", "Traditional|Percentage|AVG True
Range" );
if ( scaling == "Traditional" )
Box = Param( "Box", 1, 0.2, 10, 0.1 );
else
if ( scaling == "Percentage" )
Box = Param( "Box ", 1, 0.2, 10, 0.1 ) / 100 * LastValue( C );
else
if ( scaling == "AVG True Range" )
Box = Param( "Box", 1, 0.3, 5, 0.1 ) * LastValue( ATR ( 20 ) );
shiftChart = 0;
shiftLastClose = 1;
shiftGrid = 7;
shiftPriceAxis = 2;
Reverse = Param( "Reverse", 3, 1, 5 );
j = 0;
PFL[0] = Box * ceil( Low[0] / Box ) + Box;
PFH[0] = Box * floor( High[0] / Box );
direction = 0;
for ( i = 1; i < BarCount; i++ )
{
if ( direction[j] == 0 )
{
if ( Low <= PFL[j] - Box )
{
PFL[j] = Box * ceil( Low / Box );
}
else
{
if ( High >= PFL[j] + Reverse*Box )
{
j++;
direction[j] = 1;
PFH[j] = Box * floor( High / Box );
PFL[j] = PFL[j - 1] + Box;
}
}
}
else
{
if ( High >= PFH[j] + Box )
{
PFH[j] = Box * floor( High / Box );
}
else
{
if ( Low <= PFH[j] - Reverse * Box )
{
j++;
direction[j] = 0;
PFH[j] = PFH[j - 1] - Box;
PFL[j] = Box * ceil( Low / Box );
}
}
}
}
delta = BarCount - j - 1;
direction = Ref( direction, - delta );
Hi = Ref( PFH, -delta ) + Box / 2;
Lo = Ref( PFL, -delta ) - Box / 2;
Cl = IIf( direction == 1, Hi, Lo );
Op = IIf( direction == 1, Cl - Box, Cl + Box );
Graphcolor = IIf( direction == 1, ParamColor( "X_Color", colorBrightGreen ),
ParamColor( "O_Color", colorRed ) );
PlotOHLC( Op, Hi, Lo, Cl, "", GraphColor ,
stylePointAndFigure | styleNoLabel, 0, 0 , shiftChart );
PlotOHLC( Op, Hi, Lo, Cl, "", GraphColor , stylePointAndFigure |
styleNoLabel, 0, 0 , shiftChart );
Last = Ref( LastValue( C ), -( BarCount - 1 ) );
Plot( Last, "", colorRed, styleNoLine | styleDots, 0 , 0, shiftLastClose );
// selected value
Value = IIf( direction > 0, SelectedValue( Hi ) - box / 2, SelectedValue( Lo
) + box / 2 );
//-----------------------------------------------------------------------
// GRID CONSTRUCTION
//----------------------------------------------------------------------
PlotGridLines = ParamToggle( "PlotdGrid", "Yes! |No", 1 ) ;
if ( PlotGridLines )
{
begin = SelectedValue( BarIndex() );
end = LastValue( BarIndex() );
period = end - begin + 1;
if ( begin < end )
{
ScreenHigh = LastValue( HHV( cl, period ) );
ScreenLow = LastValue( LLV( Cl, period ) );
top = LineArray( begin - shiftGrid, screenHigh, end, screenhigh, 0 , 1 );
Bot = LineArray( begin - shiftGrid, screenlow, end, screenLow, 0, 1 );
Plot( top, "", gridColor, styleLine | styleNoLabel , 0, 0, shiftGrid );
//Plot( bot, "", gridColor,styleLine|styleNoLabel, 0 , 0 , shiftGrid);
VerticalGrid = IIf ( BarIndex() >= begin, IIf( direction == 1, screenHigh,
screenLow ), Null );
Plot ( VerticalGrid, "", gridColor, styleStaircase | styleNoLabel, 0, 0, 1
);
format = 8.2;
for ( n = LastValue( bot ); n < LastValue( top ) - 0.5*box; n = n + box )
{
Plot( bot , "", gridColor, styleLine | styleNoLabel, 0, 0 , shiftGrid );
text = NumToStr( LastValue( bot ) + 0.5 * box, format );
xposition = BarCount + shiftPriceaxis;
yPosition = LastValue( bot ) + 0.27 * box;
PlotText( text, xPosition , yPosition, colorBlue );
bot = bot + box;
Graphcolor = IIf( direction == 1, ParamColor( "X_Color", colorBrightGreen ),
ParamColor( "O_Color", colorRed ) );
PlotOHLC( Op, Hi, Lo, Cl, "", GraphColor ,
stylePointAndFigure | styleNoLabel, 0, 0 , shiftChart );
}
}
}
_SECTION_BEGIN("SU-RE");
NumLine = Param("Num Lines",2,1,20,1);
function sort(inlist)
{
//sort inlist
temp=0;
for(i = numline * 2; i>=0; i--)
{
for (j = 1; j <= i; j++)
{
if (inlist[j-1] > inlist[j] AND inlist[j-1] > 0)
{
temp = inlist[j-1];
inlist[j-1] = inlist[j];
inlist[j] = temp;
}
}
}
//inlist now sorted
return inlist;
}
//Support and resistance levels.
//using RSI
//Load into Indicator Builder
//Sensitivity of the levels can be changed with the variables
//Can test different numbers live with the Param function ctrl-R with open pane
RSIperiod = Param("RSI p",2,2,30,1);
EMAperiod = Param("EMA p",5,3,10,1);
Percent = Param("ZIG %",3,1,15,1);
HHVperiod = Param("HHV p",6,2,10,1);
NumLine = Param("Num Lines",2,1,20,1);
//Base = RSI(RSIperiod);
//Base = EMA(RSI(RSIperiod),EMAperiod);
//base = CCI(14);
Base = DEMA(RSI(RSIperiod),EMAperiod);
GraphXSpace=0.5;
//Plot(EMA(C, 10), "EMA-10", colorRed, styleLine|styleThick|styleNoRescale);
//Plot(EMA(C, 20), "EMA-20", colorBlue, styleLine|styleThick|styleNoRescale);
//Plot(EMA(C, 50), "EMA-50", colorBlack, styleLine|styleThick|styleNoRescale);
pp = (H + L + C)/3;
//Plot(EMA(Ref(pp, -1), 3), "EMA pp", colorWhite, styleLine|styleNoRescale);
red = green = 0;
for( i = 1; i <= numline; i++ )
{
ResBase = LastValue(Peak(Base,Percent,i));
SupBase = LastValue(Trough(Base,Percent,i));
Plot(ValueWhen( ResBase==Base, HHV(H,HHVperiod) ), "Resist Level", colorRed, styleLine|styleNoRescale);
Plot(ValueWhen( supbase==Base, LLV(L,HHVperiod) ), "Support Level", colorGreen, styleLine|styleNoRescale);
red = IIf(resbase == base, 1, 0);
green = IIf(supbase == base, 1, 0);
}
r1[1] = 0;
s1[1] = 0;
for (i = 1; i <= numline; i++)
{
resbase = LastValue(Peak(base, percent, i));
supbase = LastValue(Trough(base, percent, i));
r = SelectedValue(ValueWhen(resbase==base, HHV(H, HHVperiod)));
s = SelectedValue(ValueWhen(supbase==base, LLV(L, HHVperiod)));
r1 = r;
r1[i+numline] = s;
//r1 = SelectedValue(ValueWhen(resbase==base, HHV(H, HHVperiod)));
//s1 = SelectedValue(ValueWhen(supbase==base, LLV(L, HHVperiod)));
}
r1 = sort(r1);
"R1-1: " + WriteVal(r1[1], 1.2);
"R1-2: " + WriteVal(r1[2], 1.2);
"R1-3: " + WriteVal(r1[3], 1.2);
// find nearest three resistance lines (values above current high)
near_r1[1] = 0;
j = 1;
for (i = 1; i <= numline * 2; i++)
{
if(r1 > SelectedValue(H))
{
near_r1[j] = r1;
j = j + 1;
}
}
"Linregslope of Close: " + WriteVal(LinRegSlope(C, 3), 1.2);
"\nCurrent High: " + WriteVal(H, 1.2);
"\nNearest Resistance Levels:\n";
"R1: " + WriteVal(near_r1[1], 1.2);
"R2: " + WriteVal(near_r1[2], 1.2);
// find nearest three nearest support lines (values below current low)
near_s1[1] = 0;
j = 1;
for(i=numline*2; i >= 1; i--)
{
if (r1 < SelectedValue(L) AND r1 > 0)
{
near_s1[j] = r1;
j++;
}
}
"\nCurrent Low: " + WriteVal(L, 1.2);
"\nNearest Support Levels:\n";
"S1: " + WriteVal(near_s1[1], 1.2);
"S2: " + WriteVal(near_s1[2], 1.2);
// Test
/*
resbase = LastValue(Peak(base, percent, 1));
supbase = LastValue(Trough(base, percent, 1));
sup1 = ValueWhen(supbase==base, LLV(L, HHVperiod));
res1 = ValueWhen(resbase==base, HHV(H, HHVperiod));
"Resbase: " + WriteVal(resbase, 1.2);
"SUpbase: " + WriteVal(supbase, 1.2);
"Supp1: " + WriteVal(sup1, 1.2);
"Res1: " + WriteVal(res1, 1.2);
resbase = LastValue(Peak(base, percent, 2));
supbase = LastValue(Trough(base, percent, 2));
sup1 = ValueWhen(supbase==base, LLV(L, HHVperiod));
res1 = ValueWhen(resbase==base, HHV(H, HHVperiod));
"\n";
"Resbase2: " + WriteVal(resbase, 1.2);
"SUpbase2: " + WriteVal(supbase, 1.2);
"Supp2: " + WriteVal(sup1, 1.2);
"Res2: " + WriteVal(res1, 1.2);
resbase = LastValue(Peak(base, percent, 3));
supbase = LastValue(Trough(base, percent, 3));
sup1 = ValueWhen(supbase==base, LLV(L, HHVperiod));
res1 = ValueWhen(resbase==base, HHV(H, HHVperiod));
"\n";
"Resbase3: " + WriteVal(resbase, 1.2);
"SUpbase3: " + WriteVal(supbase, 1.2);
"Supp3: " + WriteVal(sup1, 1.2);
"Res3: " + WriteVal(res1, 1.2);
// End test
"\n";
"Base: " + WriteVal(base, 1.2);
WriteIf(red, "Resistance", "");
WriteIf(green, "Support", "");
"\n";
*/
"\n\n";
Title = Name() + "; " + Date() + ": Support & Resistance Levels using RSI: " + EncodeColor(colorGreen)+ "Support Levels are Green; "+EncodeColor(colorRed)+ "Resistance Levels are Red: "+EncodeColor(colorBlack)+"Number of lines of each ="+WriteVal(numline,1) +
EncodeColor(colorRed) + "\nEMA-10: " + WriteVal(EMA(C, 10), 1.2) +
EncodeColor(colorBlue) + "\nEMA-20: " + WriteVal(EMA(C, 20), 1.2) +
EncodeColor(colorBlack) + "\nEMA-50: " + WriteVal(EMA(C, 50), 1.2) ;
SetChartBkGradientFill( ParamColor("BgTop", colorTeal),ParamColor("BgBottom", colorLightGrey));
_N(Title = StrFormat("{{NAME}} - {{INTERVAL}} {{DATE}} Open %g, Hi %g, Lo %g, Close %g (%.1f%%) Vol " +WriteVal( V, 1.0 ) +" {{VALUES}}", O, H, L, C));
Hh = HHV(C,1) ;
Ll = LLV(C,1) ;
Hh = Ref(HHV(C,1),-1) ;
Ll = Ref(LLV(C,1),-1);
//Plot(Hh,"1 Bar High",colorGreen,styleLine);
//Plot(Ll,"1 Bar Low",colorRed,styleLine);
Plot(Close,"Close",
IIf(C > Hh, colorBrightGreen,
IIf(C < Ll, colorRed,
colorWhite)),
styleCandle|styleThick);
Buy = C > Hh;
Sell = C < Ll;
Buy = ExRem( Buy, Sell );
Sell = ExRem( Sell, Buy );
PlotShapes(shapeUpTriangle* Buy, colorGreen, 0, L );
PlotShapes(shapeDownTriangle* Sell, colorRed, 0, H );
"Jeevan's Advice: "+WriteVal(0);
"Bullish if Closing Above : "+WriteVal(Hh,1.01);
"Bearish if Closing Below: "+WriteVal(Ll,1.01);
"Current Close : "+WriteVal(Close,1.0);
_SECTION_END();
Similar threads
-
please code trends indicator for double lines of support and resistance
- Started by rvlv
- Replies: 0
-
-
Strangles and Straddles Amibroker combined code along with supertrend indicator buy and sell
- Started by vikas385
- Replies: 0
-
Can someone convert this amibroker trend indicator to mt4,please
- Started by kareda
- Replies: 0
-
