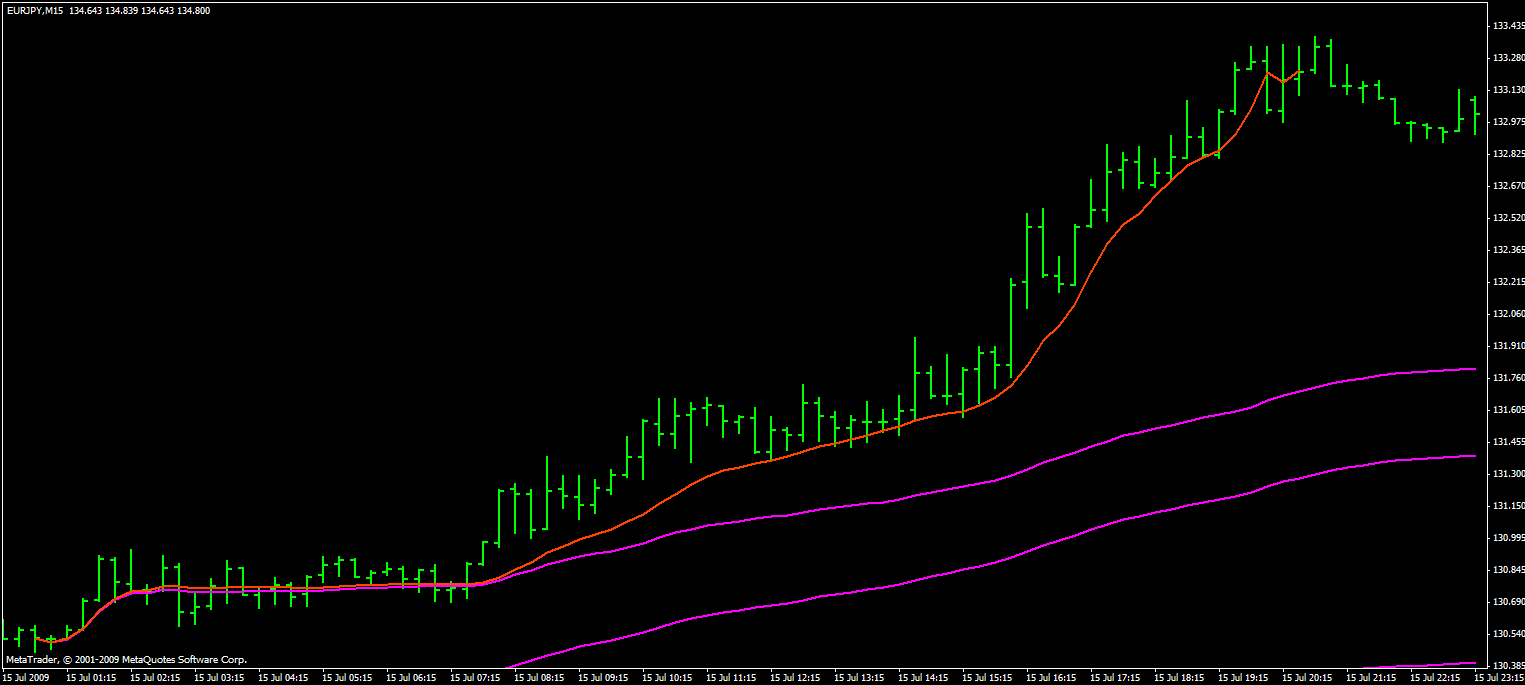
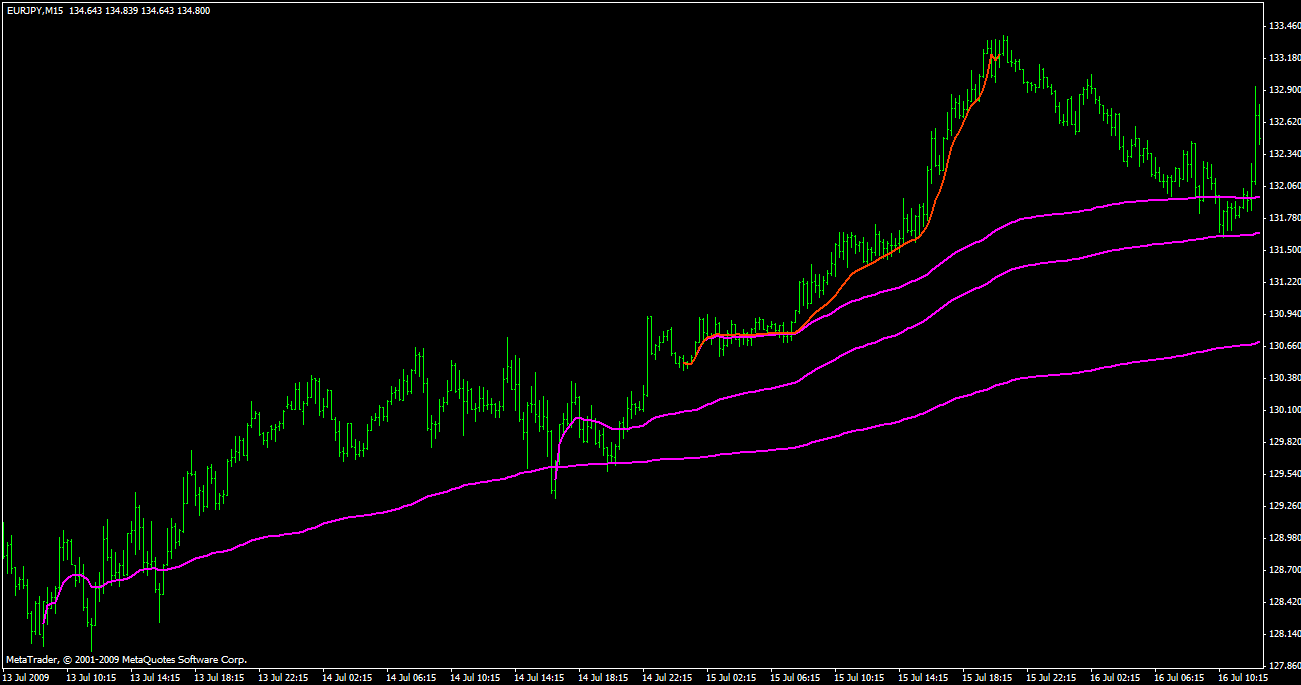
AFL coding checking needed ! Experts, thanks !
Hi, experts,
I am interested in the topfinder indicator by Dr. Paul Levine.
I found a MQ4 program with a programming of the topfinder.
I coded with Amibroker (as shown below the MQ4 program) but the result is not working. I think I was stuck by the complicated array and internal loops of amibroker programming, please help to check what is/are wrong in my programming.
Big thanks in advance.
AK
//+------------------------------------------------------------------+
//| MIDAS_v1.mq4 |
//| Akif TOKUZ |
//| Implementation is based on article "Introducing the MIDAS Method |
//| of Technical Analysis" by Dr. Paul Levine. |
//| 06.08.2009 |
//+------------------------------------------------------------------+
#property copyright "Akif TOKUZ"
#property link "[email protected]"
#property indicator_chart_window
#property indicator_buffers 4
#property indicator_color1 Magenta
#property indicator_color2 Magenta
#property indicator_color3 FireBrick
#property indicator_color4 Yellow
#property indicator_width1 2
#property indicator_width2 1
#property indicator_width3 2
#property indicator_width4 2
#property indicator_style2 2
//---- input parameters
extern datetime StartDate=D'2009.08.06 00:00';
extern bool ShowVWAP=true;
extern bool ShowTopFinder=false;
extern double TopFinderVolumeNumBars=30;
extern bool ShowShiftedVWAP=false;
extern double shift=20;
extern bool ShowAveragePrice=false;
//---- indicator buffers
double VWAP[];
double TopFinder[];
double VWAPShift[];
double AvgPrice[];
double CumVol[];//not displayed
double CumPVol[];//not displayed
//---- global variables for holding up values at fixed "start day"
double CumPVol_J=-1;
double CumVol_J=-1;
//+------------------------------------------------------------------+
//| Custom indicator initialization function |
//+------------------------------------------------------------------+
int init()
{
//---- indicators
IndicatorBuffers(6);
SetIndexBuffer(0,VWAP);
SetIndexBuffer(1,VWAPShift);
SetIndexBuffer(2,TopFinder);
SetIndexBuffer(3,AvgPrice);
SetIndexBuffer(4,CumVol);
SetIndexBuffer(5,CumPVol);
if (ShowVWAP==true) SetIndexStyle(0,DRAW_LINE);
else SetIndexStyle(0,DRAW_NONE);
if (ShowShiftedVWAP==true) SetIndexStyle(1,DRAW_LINE);
else SetIndexStyle(1,DRAW_NONE);
if (ShowTopFinder==true) SetIndexStyle(2,DRAW_LINE);
else SetIndexStyle(2,DRAW_NONE);
if (ShowAveragePrice==true) SetIndexStyle(3,DRAW_LINE);
else SetIndexStyle(3,DRAW_NONE);
string short_name="MIDAS";
IndicatorShortName(short_name);
SetIndexLabel(0,"VWAP");
SetIndexLabel(1,"AvgPrice");
SetIndexLabel(2,"TopFinder");
SetIndexLabel(3,"VWAPShift");
SetIndexLabel(4,"CumVol");
SetIndexLabel(5,"CumPVol");
//----
return(0);
}
//+------------------------------------------------------------------+
//| Custom indicator deinitialization function |
//+------------------------------------------------------------------+
int deinit()
{
//----
//----
return(0);
}
//+------------------------------------------------------------------+
//| Custom indicator iteration function |
//+------------------------------------------------------------------+
int start()
{
int i;
int counted_bars=IndicatorCounted();
double d;
double e;
double result;
double x;
double D;
//---- check for possible errors
if(counted_bars<0) return(-1);
for (i=Bars-counted_bars-1; i>=0; i--)
{
AvgPrice=(High+Low)/2;
CumVol=CumVol[i+1]+Volume;
CumPVol=CumPVol[i+1]+Volume*AvgPrice;
if (StartDate <= Time)
{
if ((CumPVol_J==-1)&&(CumVol_J==-1)) // save starting day values
{
CumPVol_J = CumPVol;
CumVol_J = CumVol;
VWAP=AvgPrice; // at the start day we need to put initial values
VWAPShift=VWAP+VWAP*shift/10000; // which are calculated differently
TopFinder=AvgPrice; // (check Dr. Levine's lectures)
}else
{
VWAP=( CumPVol - CumPVol_J ) / ( CumVol - CumVol_J );
VWAPShift=VWAP+VWAP*shift/10000;
d=( CumVol - CumVol_J ); // calculate TopFinder
D=TopFinderVolumeNumBars*(CumVol/Bars); // multiply TopFinderVolumeNumBars input with average volume per bar
e=d*(1-d/D); // when d/D gets close to 1, e will be zero.
x=CumVol-e;
if (d/D<0.9999) // protection from division by zero
{
for (int j=0;j<Bars-counted_bars-1;j++)
{
if (CumVol[j]<x) break;
}
if (j!=0) // Zero bar check
{
// interpolation required to find the exact value (again check Dr. Levine's lectures)
result= CumPVol[j]*(x - CumVol[j-1])/(CumVol[j] - CumVol[j-1]) +
CumPVol[j-1]*(x - CumVol[j])/(CumVol[j-1] - CumVol[j]);
TopFinder=( CumPVol - result ) / e;
}
}
}
}
}
//---- done
return(0);
}
//+------------------------------------------------------------------+
VolNumBars = Param("VolNumBars",50,5,1500,1);
dn = DateTime();
sd = SelectedValue( dn );
start = dn == sd;
Cv[BarCount-1] = 0;
Cpv[BarCount-1] = 0;
tfinder[0] = LastValue((H+L)/2);
startpv = -1;
startcv = -1;
for (i = BarCount -2 ; i >=0; i--)
{
mp = L;
cv = cv[i+1] + V;
cpv = cpv[i+1] + V * mp;
vwap = mp;
if (dn >= sd)
{
if (dn == sd)
{
startpv = Cpv;
startcv = Cv;
vwap = mp;
tfinder = mp;
}
else
{
vwap = (cpv - startpv)/(cv - startcv);
d = (cv - startpv);
DD = VolNumBars * cv /BarCount;
e = d * (1 - d/DD);
x = cv - e;
if (d/DD < 0.9999)
{
for (j = 0; j <BarCount-1; j++)
{
if (Cv[j] < x) break;
}
if (j !=0)
{
//interpolation
result= PV[j] * ( x - CV[j-1])/(CV[j] - CV[j-1]) + PV[j-1] * (x - CV[j]) /(CV[j-1] - CV[j]);
tfinder[j] = (PV[j] - result)/e;
}
}
}
}
}
Plot( tfinder, "TopFinder", colorRed , styleLine | styleThick | styleNoRescale );
Last edited:


