


Can anybody help- need ALF
- Thread starter Alialadin
- Start date
zultan,
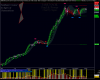
bb.zip is quite useful.
Here is image of bb.zip with KBrain v 1.0 of karthikmarar with heikin ashi
afl formula used is as follows
/*======================================================
FOREX INTRADAY HEIKIN ASHI + PIVOT POINTS
======================================================*/
//---- heikin ashi
HaClose = (O+H+L+C)/4;
HaOpen = AMA( Ref( HaClose, -1 ), 0.3 );
HaHigh = Max( H, Max( HaClose, HaOpen ) );
HaLow = Min( L, Min( HaClose, HaOpen ) );
xDiff = (HaHigh - Halow) * IIf(StrFind(Name(),"JPY"),100,10000);
barcolor = IIf(HaClose >= HaOpen,colorGreen,colorRed);
PlotOHLC( HaOpen, HaHigh, HaLow, HaClose, "", barcolor, styleCandle );
// Plot(EMA(HaClose,9),"",colorWhite, styleLine);
// Plot(EMA(HaClose,18),"",colorBlack, styleLine);
//KBrain System Coded by Karthikmarar. Blog. www.stocktechnician.blogspot.com email. [email protected]
//System based on the BrainTrend system in Metatrader
// The Turquiose colored Dot indicates start of a Up Trend
// The Magenta DOt indicates end of an Up move and beginning of a downmove
// The system is a Stop and reverse system
_SECTION_BEGIN("KBrain");
//========================Initiation========================
bts=ParamToggle("BrainTrend1 signal","No|Yes" ,0);
btst=ParamToggle("BrainTrend1 stop","No|Yes" ,0);
btsl=ParamToggle("BrainTrend1 stop line","No|Yes" ,0);
period=Param("Period",14,6,20,1);
x1=53;
x2=47;
d=2.3;
f=7;
s=1.5;
range=ATR(f);
Range1 = ATR(f)/d;
Range2 = (ATR(f)*s)/4;
range3=ATR(10);
R = ((HHV(H,period) - C) /(HHV (H,period) -LLV (L,period))) *-100;
EMA1= EMA(R,Period);
EMA2= EMA(EMA1,5);
Difference= EMA1 - EMA2;
ZeroLagEMA= EMA1 + Difference;
value2=abs(ZeroLagEMA);
function PercentR( periods )
{
return -100 * ( HHV( H, periods ) - C )/( HHV( H, periods ) - LLV( L, periods ) );
}
for( i = period+10; i < BarCount; i++ )
{
C[0]=0;
Value2[0]=0;
p[0]=0;
Plot1[0]=0;
Plot2[0]=0;
Val1=0;
Val2=0;
temp[0]=0;
Value3[0]=0;
tm[0]=0;
p1=0;
bt1[0]=0;
bt2[0]=0;
r[0]=0;
bt1a[0]=0;
bt2a[0]=0;
istop[0]=Val1[0];
stop=Val1[0];
bstop[0]=0;
sstop=0;
//==================================Indicators============================
{
if (value2 < x2 AND abs(Close-Close[i-2]) > range1)
p = 1 ;
else
{
if (value2 > x1 AND abs(Close-Close[i-2]) > Range1)
p = 2 ;
else
p=0;
}
}
if ((value2 < x2 AND p == 1) OR (value2 < x2 AND p == 0))
{
if (abs(Close-Close[i-2]) > Range1)
{
Plot1=H;
Plot2=L;
}
else
{
Plot1=Plot1[i-1];
Plot2=Plot2[i-1];
}
}
else
{
if ((value2 > x1 AND p == 2) OR (value2 > x1 AND p == 0))
{
Plot1=L;
Plot2=H;
}
else
{
Plot1=Plot1[i-1];
Plot2=Plot2[i-1];
}
}
//==================KBrain Signal ====================================
{
if (value2 < x2 AND (abs(Close-Close[i-2]) > Range1))
{
if (p == 1 OR p == 0)
Value3=L-range3;
val1=Value3;
p=1;
temp=1;
}
else
{
temp=temp[i-1];
}
{
if (value2 > x1 AND (abs(Close-Close[i-2]) > Range1))
{
if (p == 2 OR p == 0)
Value3=H+range3;
val2=Value3;
p=2;
temp=2;;
}
}
}
{
if (temp==1 AND Plot1>0 AND tm != 1)
tm= 1;
if (temp==2 AND Plot2>0 AND tm != 2)
tm=2;
}
//===============================stop========================================
{
if (value2 < x2 AND (abs(Close-Close[i-2]) > Range1)AND p !=2)
{
value3=L-range3;
va1=Value3;
p1=2;
r=Va1;
bstop=Va1;
bt2=bt2[i-1];
}
if (value2 > x1 AND (abs(Close-Close[i-2]) > Range1)AND p !=1)
{
Value3=H+range3;
va2=Value3;
p1=1;
r=Va2;
sstop=Value3;
bt1=bt1[i-1];
}
}
if (val1 == 0 AND val2 == 0 AND p == 0 )
{
bstop=bstop[i-1];
sstop=sstop[i-1];
}
if (bstop<bstop[i-1] AND tm==1 AND tm[i-1]==1) bstop=bstop[i-1];
if (sstop>sstop[i-1] AND tm==2 AND tm[i-1]==2) sstop=sstop[i-1];
}
//=============================SYSTEM======================================
Mycolor=IIf(p==1,colorLime,IIf(p==2,colorRed,colorBlue));
//PlotOHLC( Open, High, Low, Close, "", Mycolor, styleBar| styleThick );
PlotShapes( shapeCircle* (bts AND tm==1 AND Ref(tm,-1)==2),colorTurquoise, 0, bstop, 0 );
PlotShapes( shapeCircle* (bts AND tm==2 AND Ref(tm,-1)==1), colorCustom12, 0, sstop, 0 );
PlotShapes( IIf(btst AND p==1,shapeSmallCircle,Null), colorTurquoise,0,bstop,0);
Plot(IIf(btsl AND tm==1,bstop,Null),"",colorPaleBlue,1);
PlotShapes( IIf(btst AND p==2,shapeSmallCircle,Null), colorCustom12,0,sstop,0);
Plot(IIf(btsl AND tm==2,sstop,Null),"",colorLightYellow,1);
Buy=Cover=(bts AND tm==1 AND Ref(tm,-1)==2);
Sell=Short=(bts AND tm==2 AND Ref(tm,-1)==1);
SellPrice=ValueWhen(Sell,C,1);
BuyPrice=ValueWhen(Buy,C,1);
Long=Flip(Buy,Sell);
Shrt=Flip(Sell,Buy );
_SECTION_END();
//=================TITLE================================================================================================
_SECTION_BEGIN("Title");
if( Status("action") == actionIndicator )
(
Title = EncodeColor(colorWhite)+ "KBrain V 1.0. " + " - " + Name() + " - " + EncodeColor(colorRed)+ Interval(2) + EncodeColor(colorWhite) +
" - " + Date() +" - "+"\n" +EncodeColor(colorYellow) +"Op-"+O+" "+"Hi-"+H+" "+"Lo-"+L+" "+
"Cl-"+C+" "+ "Vol= "+ WriteVal(V)+"\n"+
EncodeColor(colorLime)+
WriteIf (Buy , " GO LONG / Reverse Signal at "+C+" ","")+
WriteIf (Sell , " EXIT LONG / Reverse Signal at "+C+" ","")+"\n"+EncodeColor(colorWhite)+
WriteIf(Sell , "Total Profit/Loss for the Last Trade Rs."+(C-BuyPrice)+"","")+
WriteIf(Buy , "Total Profit/Loss for the Last trade Rs."+(SellPrice-C)+"","")+
WriteIf(Long AND NOT Buy, "Trade : Long - Entry price Rs."+(BuyPrice),"")+
WriteIf(shrt AND NOT Sell, "Trade : Short - Entry price Rs."+(SellPrice),"")+"\n"+
WriteIf(Long AND NOT Buy, "Current Profit/Loss Rs."+(C-BuyPrice)+"","")+
WriteIf(shrt AND NOT Sell, "Current Profit/Loss Rs."+(SellPrice-C)+"",""));
_SECTION_END();
_SECTION_BEGIN("Keltner Bands");
P = ParamField("Price field",-1);
Periods = Param("Periods", 15, 2, 300, 1 );
Width = Param("Width", 2, 0, 10, 0.05 );
Width = 0.5 ;
Color = ParamColor("Color", colorCycle );
Style = ParamStyle("Style");
CenterLine = MA( P, Periods );
KTop = CenterLine + Width * ATR( Periods );
KBot = CenterLine - Width * ATR( Periods );
Plot( KTop, "KBTop" + _PARAM_VALUES(), Color, Style );
Plot( KBot, "KBBot" + _PARAM_VALUES(), Color, Style );
Plot( MA( P, 15 ), "", colorBlack, styleLine , styleThick);
PlotOHLC(KTop,KTop,KBot,KBot,"", colorLightBlue,styleCloud ) ;
//PlotOHLC(ACDHigh,ACDHigh,ACDLow,ACDLow,"",colorLig htBlue,styleCloud );
_SECTION_END();
//================================
_SECTION_BEGIN("Mean Band");
function SteBand( array, periods,number, upper )
{
Lr = LinearReg( array, periods );
se = StdErr( array, periods );
return LR + IIf( upper, 1, -1 ) * number * se;
}
Periods = Param("Standard Error", 80, 1, 200, 1);
Smooth = Param("Mean Smoothness",14,2,100,1);
number = Param("StdErrNo", 1, 0.2, 3.0,0.2);
parmCloudColor = ParamColor("Cloud Color", ColorRGB( 40,40,40) );
UStdErrBand = SteBand( C, Periods, number, True );
LStdErrBand = SteBand( C, Periods, number, False );
MStdErrBand = (UStdErrBand + LStdErrBand )/2;
Plot( MA(UStdErrBand,smooth), "UpperBand ", colorDarkRed,styleLine );
Plot( MA(LStdErrBand,smooth), "LowerBand ", colorDarkRed,styleLine );
Plot( MA(MStdErrBand,smooth) , "MidBand", colorPlum , styleDashed );
//Plot( Close, "Close", colorBlack, styleCandle );
PlotOHLC( MA(UStdErrBand,smooth), MA(UStdErrBand,smooth), MA(LStdErrBand,smooth) , MA(LStdErrBand,smooth) , "", parmCloudColor, styleCloud | styleNoLabel);
_SECTION_END();
Last edited:
This afl is showing a syntax error would you please check this again.
zultan,
bb.zip is quite useful.
Here is image of bb.zip with KBrain v 1.0 of karthikmarar with heikin ashi
afl formula used is as follows
/*======================================================
FOREX INTRADAY HEIKIN ASHI + PIVOT POINTS
======================================================*/
//---- heikin ashi
HaClose = (O+H+L+C)/4;
HaOpen = AMA( Ref( HaClose, -1 ), 0.3 );
HaHigh = Max( H, Max( HaClose, HaOpen ) );
HaLow = Min( L, Min( HaClose, HaOpen ) );
xDiff = (HaHigh - Halow) * IIf(StrFind(Name(),"JPY"),100,10000);
barcolor = IIf(HaClose >= HaOpen,colorGreen,colorRed);
PlotOHLC( HaOpen, HaHigh, HaLow, HaClose, "", barcolor, styleCandle );
// Plot(EMA(HaClose,9),"",colorWhite, styleLine);
// Plot(EMA(HaClose,18),"",colorBlack, styleLine);
//KBrain System Coded by Karthikmarar. Blog. www.stocktechnician.blogspot.com email. [email protected]
//System based on the BrainTrend system in Metatrader
// The Turquiose colored Dot indicates start of a Up Trend
// The Magenta DOt indicates end of an Up move and beginning of a downmove
// The system is a Stop and reverse system
_SECTION_BEGIN("KBrain");
//========================Initiation========================
bts=ParamToggle("BrainTrend1 signal","No|Yes" ,0);
btst=ParamToggle("BrainTrend1 stop","No|Yes" ,0);
btsl=ParamToggle("BrainTrend1 stop line","No|Yes" ,0);
period=Param("Period",14,6,20,1);
x1=53;
x2=47;
d=2.3;
f=7;
s=1.5;
range=ATR(f);
Range1 = ATR(f)/d;
Range2 = (ATR(f)*s)/4;
range3=ATR(10);
R = ((HHV(H,period) - C) /(HHV (H,period) -LLV (L,period))) *-100;
EMA1= EMA(R,Period);
EMA2= EMA(EMA1,5);
Difference= EMA1 - EMA2;
ZeroLagEMA= EMA1 + Difference;
value2=abs(ZeroLagEMA);
function PercentR( periods )
{
return -100 * ( HHV( H, periods ) - C )/( HHV( H, periods ) - LLV( L, periods ) );
}
for( i = period+10; i < BarCount; i++ )
{
C[0]=0;
Value2[0]=0;
p[0]=0;
Plot1[0]=0;
Plot2[0]=0;
Val1=0;
Val2=0;
temp[0]=0;
Value3[0]=0;
tm[0]=0;
p1=0;
bt1[0]=0;
bt2[0]=0;
r[0]=0;
bt1a[0]=0;
bt2a[0]=0;
istop[0]=Val1[0];
stop=Val1[0];
bstop[0]=0;
sstop=0;
//==================================Indicators============================
{
if (value2 < x2 AND abs(Close-Close[i-2]) > range1)
p = 1 ;
else
{
if (value2 > x1 AND abs(Close-Close[i-2]) > Range1)
p = 2 ;
else
p=0;
}
}
if ((value2 < x2 AND p == 1) OR (value2 < x2 AND p == 0))
{
if (abs(Close-Close[i-2]) > Range1)
{
Plot1=H;
Plot2=L;
}
else
{
Plot1=Plot1[i-1];
Plot2=Plot2[i-1];
}
}
else
{
if ((value2 > x1 AND p == 2) OR (value2 > x1 AND p == 0))
{
Plot1=L;
Plot2=H;
}
else
{
Plot1=Plot1[i-1];
Plot2=Plot2[i-1];
}
}
//==================KBrain Signal ====================================
{
if (value2 < x2 AND (abs(Close-Close[i-2]) > Range1))
{
if (p == 1 OR p == 0)
Value3=L-range3;
val1=Value3;
p=1;
temp=1;
}
else
{
temp=temp[i-1];
}
{
if (value2 > x1 AND (abs(Close-Close[i-2]) > Range1))
{
if (p == 2 OR p == 0)
Value3=H+range3;
val2=Value3;
p=2;
temp=2;;
}
}
}
{
if (temp==1 AND Plot1>0 AND tm != 1)
tm= 1;
if (temp==2 AND Plot2>0 AND tm != 2)
tm=2;
}
//===============================stop========================================
{
if (value2 < x2 AND (abs(Close-Close[i-2]) > Range1)AND p !=2)
{
value3=L-range3;
va1=Value3;
p1=2;
r=Va1;
bstop=Va1;
bt2=bt2[i-1];
}
if (value2 > x1 AND (abs(Close-Close[i-2]) > Range1)AND p !=1)
{
Value3=H+range3;
va2=Value3;
p1=1;
r=Va2;
sstop=Value3;
bt1=bt1[i-1];
}
}
if (val1 == 0 AND val2 == 0 AND p == 0 )
{
bstop=bstop[i-1];
sstop=sstop[i-1];
}
if (bstop<bstop[i-1] AND tm==1 AND tm[i-1]==1) bstop=bstop[i-1];
if (sstop>sstop[i-1] AND tm==2 AND tm[i-1]==2) sstop=sstop[i-1];
}
//=============================SYSTEM======================================
Mycolor=IIf(p==1,colorLime,IIf(p==2,colorRed,colorBlue));
//PlotOHLC( Open, High, Low, Close, "", Mycolor, styleBar| styleThick );
PlotShapes( shapeCircle* (bts AND tm==1 AND Ref(tm,-1)==2),colorTurquoise, 0, bstop, 0 );
PlotShapes( shapeCircle* (bts AND tm==2 AND Ref(tm,-1)==1), colorCustom12, 0, sstop, 0 );
PlotShapes( IIf(btst AND p==1,shapeSmallCircle,Null), colorTurquoise,0,bstop,0);
Plot(IIf(btsl AND tm==1,bstop,Null),"",colorPaleBlue,1);
PlotShapes( IIf(btst AND p==2,shapeSmallCircle,Null), colorCustom12,0,sstop,0);
Plot(IIf(btsl AND tm==2,sstop,Null),"",colorLightYellow,1);
Buy=Cover=(bts AND tm==1 AND Ref(tm,-1)==2);
Sell=Short=(bts AND tm==2 AND Ref(tm,-1)==1);
SellPrice=ValueWhen(Sell,C,1);
BuyPrice=ValueWhen(Buy,C,1);
Long=Flip(Buy,Sell);
Shrt=Flip(Sell,Buy );
_SECTION_END();
//=================TITLE================================================================================================
_SECTION_BEGIN("Title");
if( Status("action") == actionIndicator )
(
Title = EncodeColor(colorWhite)+ "KBrain V 1.0. " + " - " + Name() + " - " + EncodeColor(colorRed)+ Interval(2) + EncodeColor(colorWhite) +
" - " + Date() +" - "+"\n" +EncodeColor(colorYellow) +"Op-"+O+" "+"Hi-"+H+" "+"Lo-"+L+" "+
"Cl-"+C+" "+ "Vol= "+ WriteVal(V)+"\n"+
EncodeColor(colorLime)+
WriteIf (Buy , " GO LONG / Reverse Signal at "+C+" ","")+
WriteIf (Sell , " EXIT LONG / Reverse Signal at "+C+" ","")+"\n"+EncodeColor(colorWhite)+
WriteIf(Sell , "Total Profit/Loss for the Last Trade Rs."+(C-BuyPrice)+"","")+
WriteIf(Buy , "Total Profit/Loss for the Last trade Rs."+(SellPrice-C)+"","")+
WriteIf(Long AND NOT Buy, "Trade : Long - Entry price Rs."+(BuyPrice),"")+
WriteIf(shrt AND NOT Sell, "Trade : Short - Entry price Rs."+(SellPrice),"")+"\n"+
WriteIf(Long AND NOT Buy, "Current Profit/Loss Rs."+(C-BuyPrice)+"","")+
WriteIf(shrt AND NOT Sell, "Current Profit/Loss Rs."+(SellPrice-C)+"",""));
_SECTION_END();
_SECTION_BEGIN("Keltner Bands");
P = ParamField("Price field",-1);
Periods = Param("Periods", 15, 2, 300, 1 );
Width = Param("Width", 2, 0, 10, 0.05 );
Width = 0.5 ;
Color = ParamColor("Color", colorCycle );
Style = ParamStyle("Style");
CenterLine = MA( P, Periods );
KTop = CenterLine + Width * ATR( Periods );
KBot = CenterLine - Width * ATR( Periods );
Plot( KTop, "KBTop" + _PARAM_VALUES(), Color, Style );
Plot( KBot, "KBBot" + _PARAM_VALUES(), Color, Style );
Plot( MA( P, 15 ), "", colorBlack, styleLine , styleThick);
PlotOHLC(KTop,KTop,KBot,KBot,"", colorLightBlue,styleCloud ) ;
//PlotOHLC(ACDHigh,ACDHigh,ACDLow,ACDLow,"",colorLig htBlue,styleCloud );
_SECTION_END();
//================================
_SECTION_BEGIN("Mean Band");
function SteBand( array, periods,number, upper )
{
Lr = LinearReg( array, periods );
se = StdErr( array, periods );
return LR + IIf( upper, 1, -1 ) * number * se;
}
Periods = Param("Standard Error", 80, 1, 200, 1);
Smooth = Param("Mean Smoothness",14,2,100,1);
number = Param("StdErrNo", 1, 0.2, 3.0,0.2);
parmCloudColor = ParamColor("Cloud Color", ColorRGB( 40,40,40) );
UStdErrBand = SteBand( C, Periods, number, True );
LStdErrBand = SteBand( C, Periods, number, False );
MStdErrBand = (UStdErrBand + LStdErrBand )/2;
Plot( MA(UStdErrBand,smooth), "UpperBand ", colorDarkRed,styleLine );
Plot( MA(LStdErrBand,smooth), "LowerBand ", colorDarkRed,styleLine );
Plot( MA(MStdErrBand,smooth) , "MidBand", colorPlum , styleDashed );
//Plot( Close, "Close", colorBlack, styleCandle );
PlotOHLC( MA(UStdErrBand,smooth), MA(UStdErrBand,smooth), MA(LStdErrBand,smooth) , MA(LStdErrBand,smooth) , "", parmCloudColor, styleCloud | styleNoLabel);
_SECTION_END();
Similar threads
-
-
-
Can anybody help download streaming data into excel, please?
- Started by newtrader101
- Replies: 7
-

-