Hello everybody
i have written a simple afl which plot 52 week high low on price chart even on hourly,15min,5min chart means if abc week high low is 300 and 100 but if u change chart to hourly the 52 week high low will be changed also but it shows real 52 week high low of 300 and 100
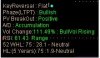
use it as overlay on your price chart , if 52 week high low line bother you just right click parameter and click hidden column on style, and style 2
i have written a simple afl which plot 52 week high low on price chart even on hourly,15min,5min chart means if abc week high low is 300 and 100 but if u change chart to hourly the 52 week high low will be changed also but it shows real 52 week high low of 300 and 100
use it as overlay on your price chart , if 52 week high low line bother you just right click parameter and click hidden column on style, and style 2