Hello,
In AmiBroker, you can see Volume-at-price indicator in well separated lines as in QuoteTracker. For this purpose, you will have to use PlotVAPOverlayA() function instead of normal PlotVAPOverlay() function.
_SECTION_BEGIN("Volume-at-Price");
MySegment = Interval();
PlotVAPOverlayA( MySegment, Param("Lines", 300, 100, 1000, 1 ), Param("Width", 50, 1, 100, 1 ), ParamColor("Color", colorGreen), ParamToggle("Side", "Left|Right" ) | 2 * ParamToggle("Style", "Fill|Lines", 0) | 4*ParamToggle("Z-order", "On top|Behind", 1 ) );
_SECTION_END();
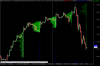
Here you will see that the lines are well-separated, as in QuoteTracker. You can look at "lines" as the resolution of the Volume-at-Price chart. Thick bars actually will make separation of bars very difficult to spot the difference between adjacent prices. So in my opinion, lines provide a finer control over the look and feel of the chart than bars.
The advantage of PlotVAPOverlayA() is that you can divide Volume-at-Price in segments as per your choice. Say, if you want to see intraday charts with Volume-at-price for each day separately, you can re-write this code as :
_SECTION_BEGIN("Volume-at-Price");
MySegment = Day();
MySegment = MySegment != Ref( MySegment, -1 );
PlotVAPOverlayA( MySegment, Param("Lines", 300, 100, 1000, 1 ), Param("Width", 50, 1, 100, 1 ), ParamColor("Color", colorGreen), ParamToggle("Side", "Left|Right" ) | 2 * ParamToggle("Style", "Fill|Lines", 0) | 4*ParamToggle("Z-order", "On top|Behind", 1 ) );
_SECTION_END();
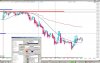
Now you will see that Volume-at-price is "grouped by" day. As usual, you can right click on the chart, go to Parameters and edit colour for the lines, no. of lines, width, display location, etc..
Also, because volumes are summed-up on particular price levels, there may be several candles summing up to a particular level - so having colour coded lines is not really possible.
Enclosed herewith is the screenshot for 2nd variation.
As regards to indicators, please visit online AFL library at
http://www.amibroker.com/library/list.php where you will find AFL for lot of indicators and much more.
I hope this helps.
Best regards,
AmiBroker-India