Hello guys,
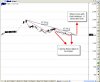
I'd like to have zigzag retracements like this:
http://charts.dacharts.com/2008-10-12/Johnny_Chart78.png
I found this code somewhere:
Unfortunately it isn't very effective because it doesn't show all of the retracements. Can anyone pls make it better?
Thank you in advance for help.
Regards,
Davide
I'd like to have zigzag retracements like this:
http://charts.dacharts.com/2008-10-12/Johnny_Chart78.png
I found this code somewhere:
Code:
_SECTION_BEGIN("ZigZag Retracement");
function GetXSupport(Lo, Percentage, Back)
{
 return ((BarCount - 1) - LastValue(TroughBars(Lo, Percentage,Back)));
}
function GetYSupport(Lo, Percentage, Back)
{
 return (LastValue(Trough(Lo, Percentage, back)));
}

function GetXResistance(Hi, Percentage, Back)
{
 return ((BarCount - 1) -LastValue(PeakBars(Hi, Percentage, Back)));
}
function GetYResistance(Hi, Percentage, Back)
{
 return (LastValue(Peak(Hi, Percentage, Back)));
}

//////////////////////////////////////////////////////////////////
Per = Param("Period", 5.9618, .1, 20, .001);
Period = Param("Look back", 10, 1, BarCount-1);
ShowRet = ParamToggle("Show Retracement values", "No|Yes",1);
Price = ParamList("Price to follow:", "Close|High|Low", 0);
if(Price=="Close") ZigP = Zig(C, per);
else if(Price=="High") ZigP = Zig(H, per);
else ZigP = Zig(L, per);

//////////////////////////////////////////////////////////////////
Plot(C, "", IIf(O>=C, colorDarkRed, colorDarkGreen), ParamStyle("Price
Style",styleBar,maskPrice));
Plot(ZigP, "Zig", colorGold, styleThick);
//////////////////////////////////////////////////////////////////

xs1 = GetXSupport(ZigP, .01, 1);
xr1 = GetXResistance(ZigP, .01, 1);
ys1 = GetYSupport(ZigP, .01, 1);
yr1 = GetYResistance(ZigP, .01, 1);

if(xs1 < xr1)
{
	x = LineArray(xs1, ys1, BarCount - 1, LastValue(ZigP));
	Down = (yr1 - LastValue(ZigP)) / (yr1 - ys1);
	DnBars = BarCount - 1 - xr1;
	Plot(x, "", colorRed, styleDots);
	PlotText(StrFormat("%.3f (%.0f)", Down, DnBars), (xs1 + BarCount -1)/2,
(ys1+LastValue(ZigP))/2, colorWhite);
}
else
{
	x = LineArray(xr1, yr1, BarCount - 1, LastValue(ZigP));
	Up = (LastValue(ZigP) - ys1) / (yr1 - ys1);
	UpBars = BarCount - 1 - xs1;
	Plot(x, "", colorRed, styleDots);
	PlotText(StrFormat("%.3f (%.0f)", Up, UpBars), (xr1 + BarCount -1)/2,
(yr1+LastValue(ZigP))/2, colorWhite);
}
Plot( 1, "", IIf( xs1 > xr1, colorGreen,
colorRed),styleOwnScale|styleArea|styleNoLabel, -0.5, 100 );
if(ShowRet)
for(i=2; i<=Period+1; i++)
{
	xs0 = GetXSupport(ZigP, .01, i);
	xs1 = GetXSupport(ZigP, .01, i-1);
	ys0 = GetYSupport(ZigP, .01, i);
	ys1 = GetYSupport(ZigP, .01, i-1);

	xr0 = GetXResistance(ZigP, .01, i);
	xr1 = GetXResistance(ZigP, .01, i-1);
	yr0 = GetYResistance(ZigP, .01, i);
	yr1 = GetYResistance(ZigP, .01, i-1);

	xs = LineArray(xs0, ys0, xs1, ys1, 0);
	Plot(xs, "", colorGold, styleLine|styleDashed);
	xr = LineArray(xr0, yr0, xr1, yr1, 0);
	Plot(xr, "",  colorGold, styleLine|styleDashed);
	if(xs1 < xr1)
	{
		Up = (yr1 - ys1) / (yr0 - ys1);
		Down = (yr0 - ys1) / (yr0 - ys0);
		UpBars = xr1 - xs1;
		DnBars = xs1 - xr0;
	}
	else
	{
		Up = (yr1 - ys0) / (yr0 - ys0);
		Down = (yr1 - ys1) / (yr1 - ys0);
		UpBars = xr1 - xs0;
		DnBars = xs1 - xr1;
	}
	PlotText(StrFormat("%.3f (%.0f)", Up, UpBars), (xr1 + xr0)/2, (yr1+yr0)/2,
colorWhite);
	PlotText(StrFormat("%.3f (%.0f)", Down, DnBars), (xs1 + xs0)/2, (ys1+ys0)/2,
colorWhite);
	//Plot(LineArray(xs0, ys0, BarCount-1, ys0), "", colorGreen, styleDashed);
	//Plot(LineArray(xr0, yr0, BarCount-1, yr0), "", colorRed, styleDashed);

}

str = StrFormat("   (Bars to END=%.0f)\n", BarCount - 1 - BarIndex());
Title =FullName()+" ("+Name()+") - "+Date()+" - Open: "+O+", Hi: "+H+", Lo:
"+L+", Close: "+C+StrFormat(" (%.2f  %.2f%%)", C-Ref(C, -1),
SelectedValue(ROC(C, 1)))+str;
WriteIf(1, "\nNote Fibonacci numbers:\nPrimary numbers: 0.618, 0.786, 1.27 and
1.618","");
WriteIf(1, "Secondary numbers: 0.382, 0.50, 1.00, 2.00, 2.24, 2.618 and
3.14","");


_SECTION_END();Thank you in advance for help.
Regards,
Davide