


Experiments in Technical Analysis
- Thread starter karthikmarar
- Start date
Hi All
Continuing on the NPO..
Our friend CV had posted a question on this indicator, but chose to delete the same. I wonder why he deleted that as the post had genuine question. He had asked about the effect of Tails, shocks and about the lag of the indicator. In my opinion as we are using a long-term average Tails and shocks may not have a big impact on this indicator unlike the ADX. Since we are again using moving average and a long period the NPO is lagging. But it is quite suitable for a positional trader. A positional trader has to accept a reasonable peak to close draw down, I think.
The NPO can be used as a complimentary Indicator only. Trying to trade with NPO alone could be quite dangerous. But NPO does give a good idea on trend and ranging stocks.
One thing we have to remember is that all indicators are based on history and history does have impact on the future movement of the indicator. Consider a stock ranging for quite some time and it starts moving up. Most indicators including MACD and ADX would immediately catch this movement. But if the stock has been in a long downtrend and reaches a bottom and immediately starts rallying, then most indicators are slow to react. Hence try to read the indicators considering the immediate past. I feel this fact does have a large impact on scans based on indicators and back testing too
Enclosing the afl for the NPO Indicator
I have smoothed the raw NPO with a technique, which introduces least lag.
You can experiment with different periods, different parameters like average price instead of Close etc.
Happy experimenting. Do share your views..
Warm regards
Karthik
Last edited:
U
Karthik,
Your this part
"I have smoothed the raw NPO with a technique, which introduces least lag." ,i have a suggestion.
As you have used a type of 'Autoregressive integrated moving average' model ,you used the Vector of Error ,this can be termed as VARIMA model,but to avoid the seasonality effect ( long range dependence) in the Time Series a Fractional ARIMA model can be tried,for Normalization,my knowledge of Ami Lang is zero,hence just a suggestion.
Jesse is very right but your logic of TF is not undisputed.
As usual another 'Gem' of contribution from you.
Asish
C
Our friend CV had posted a question on this indicator, but chose to delete the same. I wonder why he deleted that as the post had genuine question. He had asked about the effect of Tails, shocks and about the lag of the indicator. In my opinion as we are using a long-term average Tails and shocks may not have a big impact on this indicator unlike the ADX. Since we are again using moving average and a long period the NPO is lagging. But it is quite suitable for a positional trader. A positional trader has to accept a reasonable peak to close draw down, I think.
I thought about it for a while and figured out the answers to the Qs that I had, so decided to delete my post.The indicator is indeed quite useful if used correctly, I am currently looking at variations of it on intraday data.
Cheers
A
Hi Friends
It has been a long time since I actively participated in the forum. The forum does look a lot different now. Tipsters are aplenty and we even have daily horoscopes. Looks like what is lacking is an agony aunt to answer personal problems
I was a little confused on whether there would be any point in continuing this thread. Anyway a little stuff for those who still believes in conventional TA.
Let us keep aside trading systems for a while and look at some indicators. First let me remind you that all my work is aimed towards positional trades and may not be applicable to other types of trades.
The most difficult question for trend followers is whether the stock is trending or ranging. We try to use many indicators like the ADX to judge whether the stock is trending or ranging. Let us try to add one more to our arsenal of Indicators.
We will use a statistical formula commonly known as the z score. The z score indicates how many standard deviation a data is above or below the mean value. In terms of stock prices the z score would indicate how many standard deviation a days price is above or below a the average price. The z score is calculated by dividing the difference between the close and average by the standard deviation of the close itself.
When a stock is trending up the z score is increasing and generally is above one standard deviations from the average. During a downtrend the z score will be below one standard deviations from the average. In a ranging market the z score would be between +1 and 1 standard deviation.
The z score normalizes the prices over a period. We will select three months as the period for normalization.( 60 days assuming 20 trading days per month)
So the z score formula would be C-MA(C,60)/ Stddev(C,60).
Of course, we have to christen this Indicator. I prefer to call it Normalized Price Oscillator or NPO.
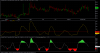
We will plot the NPO with lines corresponding 1, 2 and 3 standard deviation. You will notice that during up trends the NPO is generally above the +1 line and in a downtrend the NPO is generally below the 1 line. During a ranging market the NPO wanders between the +1 and 1 line. Strong trends are indicated when the NPO is above or below the two standard deviation lines. I am enclosing a chart of the NPO. More on this later.
warm regards
Karthik
It has been a long time since I actively participated in the forum. The forum does look a lot different now. Tipsters are aplenty and we even have daily horoscopes. Looks like what is lacking is an agony aunt to answer personal problems
I was a little confused on whether there would be any point in continuing this thread. Anyway a little stuff for those who still believes in conventional TA.
Let us keep aside trading systems for a while and look at some indicators. First let me remind you that all my work is aimed towards positional trades and may not be applicable to other types of trades.
The most difficult question for trend followers is whether the stock is trending or ranging. We try to use many indicators like the ADX to judge whether the stock is trending or ranging. Let us try to add one more to our arsenal of Indicators.
We will use a statistical formula commonly known as the z score. The z score indicates how many standard deviation a data is above or below the mean value. In terms of stock prices the z score would indicate how many standard deviation a days price is above or below a the average price. The z score is calculated by dividing the difference between the close and average by the standard deviation of the close itself.
When a stock is trending up the z score is increasing and generally is above one standard deviations from the average. During a downtrend the z score will be below one standard deviations from the average. In a ranging market the z score would be between +1 and 1 standard deviation.
The z score normalizes the prices over a period. We will select three months as the period for normalization.( 60 days assuming 20 trading days per month)
So the z score formula would be C-MA(C,60)/ Stddev(C,60).
Of course, we have to christen this Indicator. I prefer to call it Normalized Price Oscillator or NPO.
We will plot the NPO with lines corresponding 1, 2 and 3 standard deviation. You will notice that during up trends the NPO is generally above the +1 line and in a downtrend the NPO is generally below the 1 line. During a ranging market the NPO wanders between the +1 and 1 line. Strong trends are indicated when the NPO is above or below the two standard deviation lines. I am enclosing a chart of the NPO. More on this later.
warm regards
Karthik
Hi Karthik,
Sorry for hacking this thread or its topic in middle, in general Z score is often refered to or used to estimate profitunity or profitability of a model or system, pls correct me if i am wrong
Z Score for a trading system is calculated by the following formula:
Z=(N*(R-0.5)-P)/((P*(P-N))/(N-1))^(1/2)where:
N - total amount of trades in a series;
R - total amount of series of profitable and losing trades;
P = 2*W*L;
W - total amount of profitable trades in the series;
L - total amount of losing trades in the series.
U
Amarnath,
You are refering the 'Altman's Variate' type ,normally used for measuring Bankruptcy,here karthik has used the 'Leadership Test' type
Z= X - M / SD
Z score equals the “Raw” Score received (e.g., the score on the leadership test) minus the Mean or Average and then Divided by the Standard Deviation.(It is a kind of Error estimation when used in Time Series).
The main beauty is in the Normalization.
Asish
| Thread starter | Similar threads | Forum | Replies | Date |
|---|---|---|---|---|
|
|
My experiments with MFs | Mutual Funds Discussion Forum | 86 | |
| R | Experiments with Market Profile | Advanced Trading Strategies | 53 | |
| G | Trading logs/experiments | Commodities | 8 | |
|
|
My Experiments with Charts | Members Discussion Forums | 1 | |
|
|
Experiments with OBV | Advanced Trading Strategies | 199 |