Volume Spread Analysis

lazytrader

Well-Known Member
Your explanation on the END of upmove is simply fantastic! :thumb:

You seem to be an expert fisherman, unfortunately there are not many left now and the new guys are most of the time trying to get free fish. I am learning myself and made some good catches myself but it always good to have help form experienced guys. Hope the good times return and we can all then discuss on how to catch fish again instead of which fish to catch.

:D:D

Didn't quite understand which bar's you were referring to here:
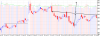
After this has been pierced , visually this looks like the price is moving up on Narrow Spread on Low Volumes. In that cluster of 'Blue Bars' , the second one is a No Demand Bar and price will never surge till the time there is Demand from Professional Money.
 

Placebo

Well-Known Member
Hi Lazy..Thank You for the kind words but i'm just a student of the market.

Kindly Refer to the chart posted by Karthik : After the 1st level of Support was taken out the bigger support level (low of selling climax) was also taken out on More Than Average Volumes. Then prices started moving upwards and the Blue Colour Bars appeared (just under the O of SUZLON). Now the 2nd blue colour bar is of utmost importance as this has moved up on Narrow Spread on Less Than Average Volumes. How do i know this ? Karthik has plotted a moving average for volumes and this bar very clearly shows that the volumes are ultra-low. This is a No Demand Bar. The reason is because price has moved up in an area where initially very high volumes were used to move the prices up (Climax Bar) and then High Volumes were used to move the prices down (High Volume Bar after Upthrust and the ones after that). This means that price has been fluctuating between Support and Resistance Levels. And if this holds true then the price has taken out a Resistance Level on Less Than Average Volumes on a Narrow Spread Bar which is a False Breakout and the best place to short the Asset

Cheers
 

lazytrader

Well-Known Member
Can volume spread analysis be applied to an index as well? Nifty has 2/3rds of NSE market cap.

The reason I asked is to check if we can use VSA to take a call on Nifty. If you notice in the chart below the volume for the past few days, ever since we bounced back from 3919 the volume was rising and then in the last 3 days in the last week the volume has been falling as nifty rose. Also in on the down days today and day before the volume has been higher than the up days. Could this mean that the rally is stalling?

I was trying to add average volume to the chart and came across this funny looking macd style percentage volume oscillator. Could this be useful in VSA?
 

Attachments

lazytrader

Well-Known Member
Thanks for your reply Kathik, I too was thinking about too much supply coming in above 4700 but the "stopping volume" and stuff you mentioned is still going over my head. I will have read the thread again.

I have my doubts about using the volumes of futures, does it have direct correlation with the spot volumes? I don't get nifty spot volumes so I cant check.
 

lazytrader

Well-Known Member
I found one more interesting chart: Bharatforge [BHARATFORG]

It has gone through a long period of consolidation and formed a cup-n-handle. What I found interesting in the chart is the points at 1,2,3 where there are funny looking large spreads. I don't know what to make of it but I though you guys may have a better idea. I have seen these long spikes and used to think they are just someones orders getting exectued at the wrong price.

My analysis in this case would be simple: once the cup has been formed buy the breakout or in this case the handle formed with a low of 61.8% retracement around 125 so that would be the entry.

P.S: the green line is the 10day ema of volume. Wht do you guys use for ma vol?
 
Last edited:

lazytrader

Well-Known Member
Since there are no markets in the weekend I look at a lot of charts. :D

Looking at reliance I feel that after going through a period of accumulation reliance broke out and hit its target of 1840 and after a few days gapped up on open above this level and then went on to touch 2500. Now my question is can smart money actually move this heavyweight as easily as smaller market cap stocks?

I'm afraid that the stock has hit a high at 2500 and not going anywhere above it anytime soon. Looking a the largevolume down moves it looks like it is distribution mode. Could Anil have spooked the SM out of this one? Although it has formed a IHnS with technical traget of 2500 I don't think it a the right way to look at a bottom reversal pattern.

I am currently holding reliance and wanted to get a VSA view on it. Please do correct me as necessary.

Also one more stock - airtel. I don't even feel we need to look at the charts. Looks like definite distribution.

In both stocks its the news flow that is affecting them. Now what is more important? If there is favourable news flow but SM is out then will the stock adv or dec? Is it always the SM that moves the stock?
 

Attachments

lazytrader

Well-Known Member
Hi guys, after learning quite a bit about everything (jack of all trade :D) I've attempted to put my TA knowledge together (everthing from candlesticks to VSA) in the below chart for analysis.
.
I would really like you guys to correct me if you feel there is any mistake and hear your views/alternate views on it. Any comments will be appreciated
 

Similar threads